Storage Operations
SolidFire Volumes
SolidFire sold all-flash storage that guaranteed each volume its own performance. I designed the Volumes view in its web UI: the grid where a storage admin manages thousands of volumes, finds the one an application team is complaining about, and diagnoses it without leaving the list.
A grid for the whole cluster
SolidFire sold all-flash storage to service providers and large enterprises. Every volume on a cluster had a guaranteed minimum, a maximum and a burst allowance of IOPS, so one noisy tenant couldn’t slow down the rest.
A cluster could hold thousands of volumes. The Volumes view is where a storage admin spends the day: creating, cloning and snapshotting them, and answering the question an application team brings when their database gets slow. Which volume, and why?
Every signal in the row
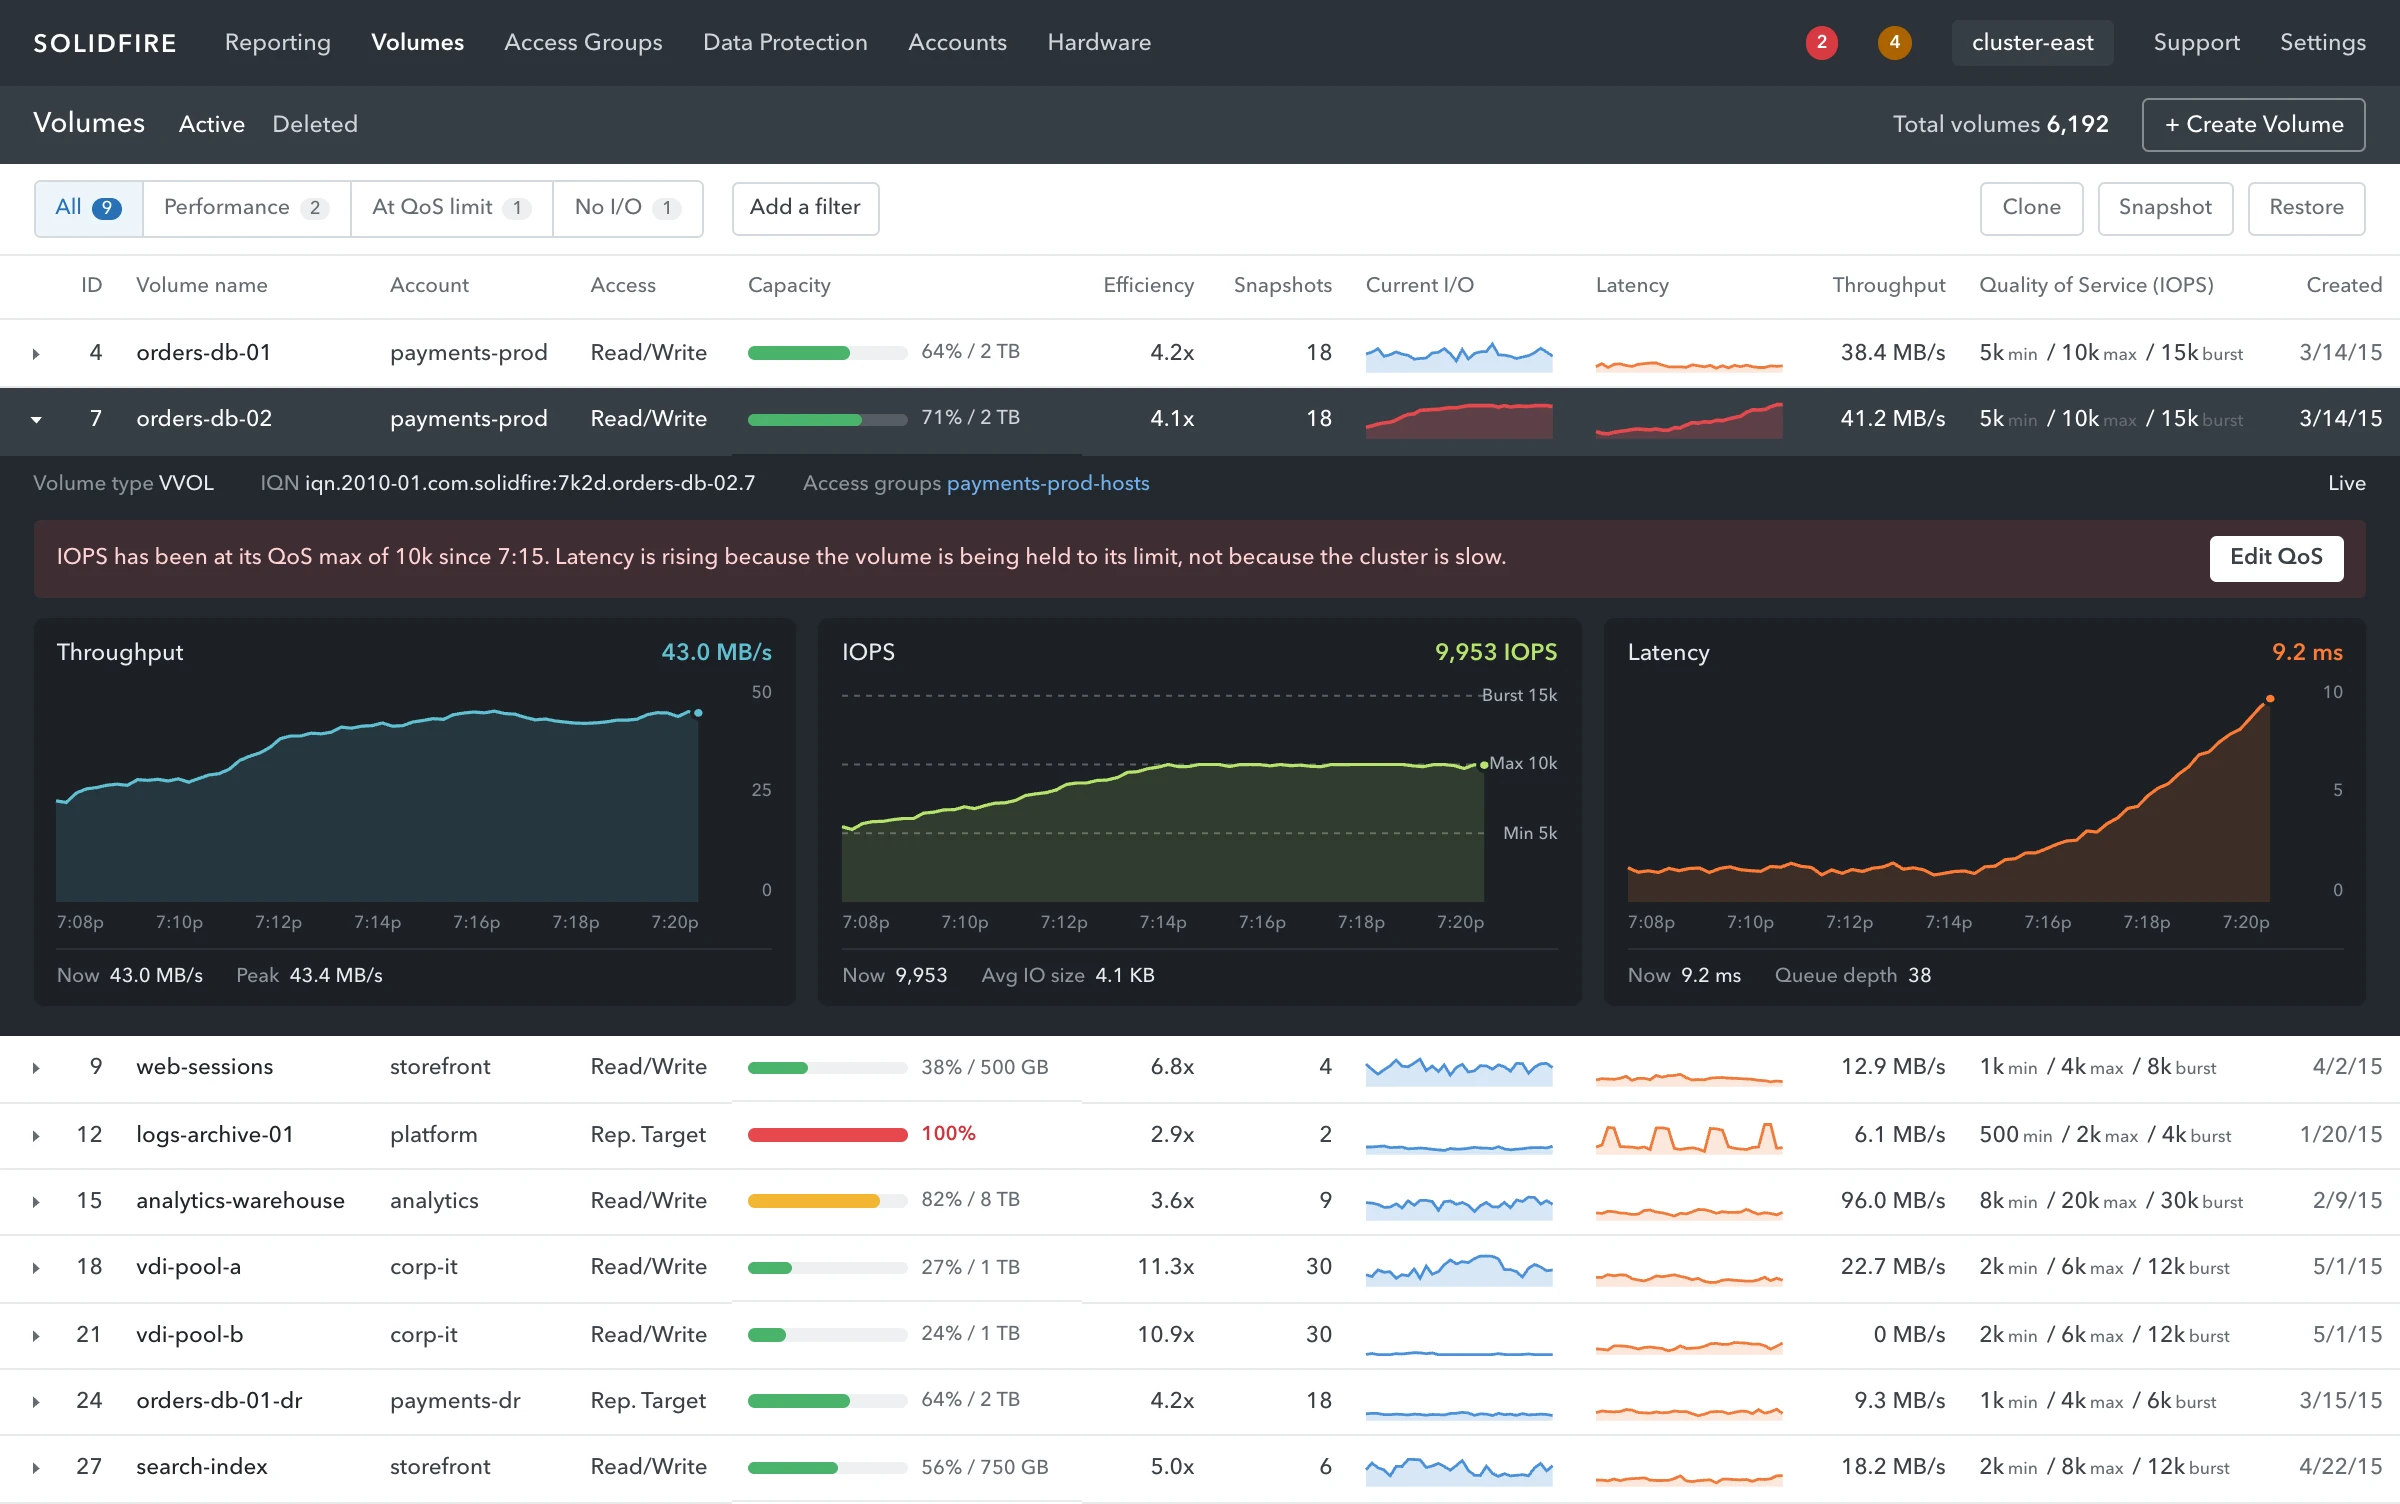
The row is the first step of the diagnosis. Each one carries capacity, efficiency, snapshots, current I/O, latency, throughput and its quality of service, so a scan down the list finds the volume worth opening.
Capacity is a bar that turns amber past 80% and red when the volume is full. Current I/O and latency are sparklines over the last twelve minutes, blue and orange, and either turns red when it is the problem. QoS reads as three numbers, in the order the system enforces them.
Open it where it is
The previous UI opened a volume on a screen of its own. Here, opening a volume doesn’t leave the grid. Its throughput, IOPS and latency open under its row, on one time axis, and the rest of the list stays where it was. Six thousand rows deep, losing your place is the expensive part.
The filters across the top cut the list to the volumes worth a look: the ones with a performance problem, the ones at their QoS limit, the ones with no I/O at all.
| ID | Volume name | Account | Access | Capacity | Efficiency | Snapshots | Current I/O | Latency | Throughput | Quality of Service (IOPS) | Created | |
|---|---|---|---|---|---|---|---|---|---|---|---|---|
| 4 | orders-db-01 | payments-prod | Read/Write | 64% / 2 TB | 4.2x | 18 | 38.4 MB/s | 5kmin / 10kmax / 15kburst | 3/14/15 | |||
| 7 | orders-db-02 | payments-prod | Read/Write | 71% / 2 TB | 4.1x | 18 | 41.2 MB/s | 5kmin / 10kmax / 15kburst | 3/14/15 | |||
| 9 | web-sessions | storefront | Read/Write | 38% / 500 GB | 6.8x | 4 | 12.9 MB/s | 1kmin / 4kmax / 8kburst | 4/2/15 | |||
| 12 | logs-archive-01 | platform | Rep. Target | 100% | 2.9x | 2 | 6.1 MB/s | 500min / 2kmax / 4kburst | 1/20/15 | |||
| 15 | analytics-warehouse | analytics | Read/Write | 82% / 8 TB | 3.6x | 9 | 96.0 MB/s | 8kmin / 20kmax / 30kburst | 2/9/15 | |||
| 18 | vdi-pool-a | corp-it | Read/Write | 27% / 1 TB | 11.3x | 30 | 22.7 MB/s | 2kmin / 6kmax / 12kburst | 5/1/15 | |||
| 21 | vdi-pool-b | corp-it | Read/Write | 24% / 1 TB | 10.9x | 30 | 0 MB/s | 2kmin / 6kmax / 12kburst | 5/1/15 | |||
| 24 | orders-db-01-dr | payments-dr | Rep. Target | 64% / 2 TB | 4.2x | 18 | 9.3 MB/s | 1kmin / 4kmax / 6kburst | 3/15/15 | |||
| 27 | search-index | storefront | Read/Write | 56% / 750 GB | 5.0x | 6 | 18.2 MB/s | 2kmin / 8kmax / 12kburst | 4/22/15 | |||
The working prototype plays on a larger screen.
Limit or load
A slow volume on SolidFire is slow for one of two reasons. Either the cluster is busy, or the volume is doing exactly what its QoS told it to do. The two look the same from the application, and the fixes are opposite: move load, or raise a limit.
So the IOPS chart draws the volume’s own minimum, maximum and burst. When IOPS runs flat along the maximum and latency climbs beside it, the answer is on the screen: the volume is being held to its limit. All three charts share one cursor, so the minute IOPS hit the ceiling is the minute latency started to rise.
What it trades
The grid is dense on purpose, because density is how an expert sees a lot at once. Thirteen columns at forty pixels a row ask a lot of a first-time user, and give a daily one a whole screen of volumes to compare at once. The drilldown pushes the rows below it down instead of opening over them, so the list moves, but nothing it held is hidden.
Where it landed
At SolidFire I set up the design team across marketing and engineering and led the overhaul of its software, the cluster’s web UI and its SaaS monitoring, along with the website. The Volumes view shipped in Element OS.
- Role
- Staff Designer, then Head of Product Design
- Year
- 2015
- Shipped
- Element OS
- Platform
- Web
- Prototype
- Rebuilt from the 2015 design
- Sample data
- The cluster, accounts and volumes