SaaS Analytics
Baremetrics Plans
Baremetrics turned a Stripe account into the numbers a SaaS founder runs on. In June 2014 I redesigned the breakdown of revenue by plan, so a founder could see which plans carry the business, how each is moving, and which have earned nothing at all.
A list, not a comparison
Baremetrics read a company’s Stripe account and turned it into the numbers a SaaS founder runs on: monthly recurring revenue, growth, churn. In June 2014 its MRR page ended in a list of every plan, by name, each with its revenue and a bar.
To answer the question a founder actually brings, which plans pay, you read all sixteen rows. A monthly plan worth $6,443 sat between two yearly ones. Five plans had earned nothing and still took a row each.

| Plan | Current MRR | % of Total | Flux | Month Trend |
|---|---|---|---|---|
| Agency - $250 | $4,250 | 26% | 12% | |
| Agency Yearly - $2,550 | $2,763 | 17% | 6% | |
| Awesome - $19 | $1,672 | 10% | 3% | |
| Awesome Yearly - $192 | $1,216 | 7% | 2% | |
| Business - $100 | $1,200 | 7% | 2% | |
| Business Yearly - $1,020 | $1,020 | 6% | 7% | |
| Enterprise 1 - $320 | $960 | 6% | 9% | |
| Enterprise 500 - $715 | $715 | 4% | 24% | |
| Enterprise 2 - $325 | $650 | 4% | 10% | |
| Enterprise 30 members - $300 | $600 | 4% | 11% | |
| Enterprise300 - $465 | $465 | 2.9% | 2% | |
| Low Agency w/ discount - $199 | $398 | 2.4% | 4% | |
| Business Plus - $99 | $198 | 1.2% | 6% | |
| Business Plus Yearly - $1,010 | $168 | 1% | 8% | |
| Pro - $102 | $0 | 0% | 22% | |
| Pro - $10 | $0 | 0% | 11% |
One table, one picture of the whole
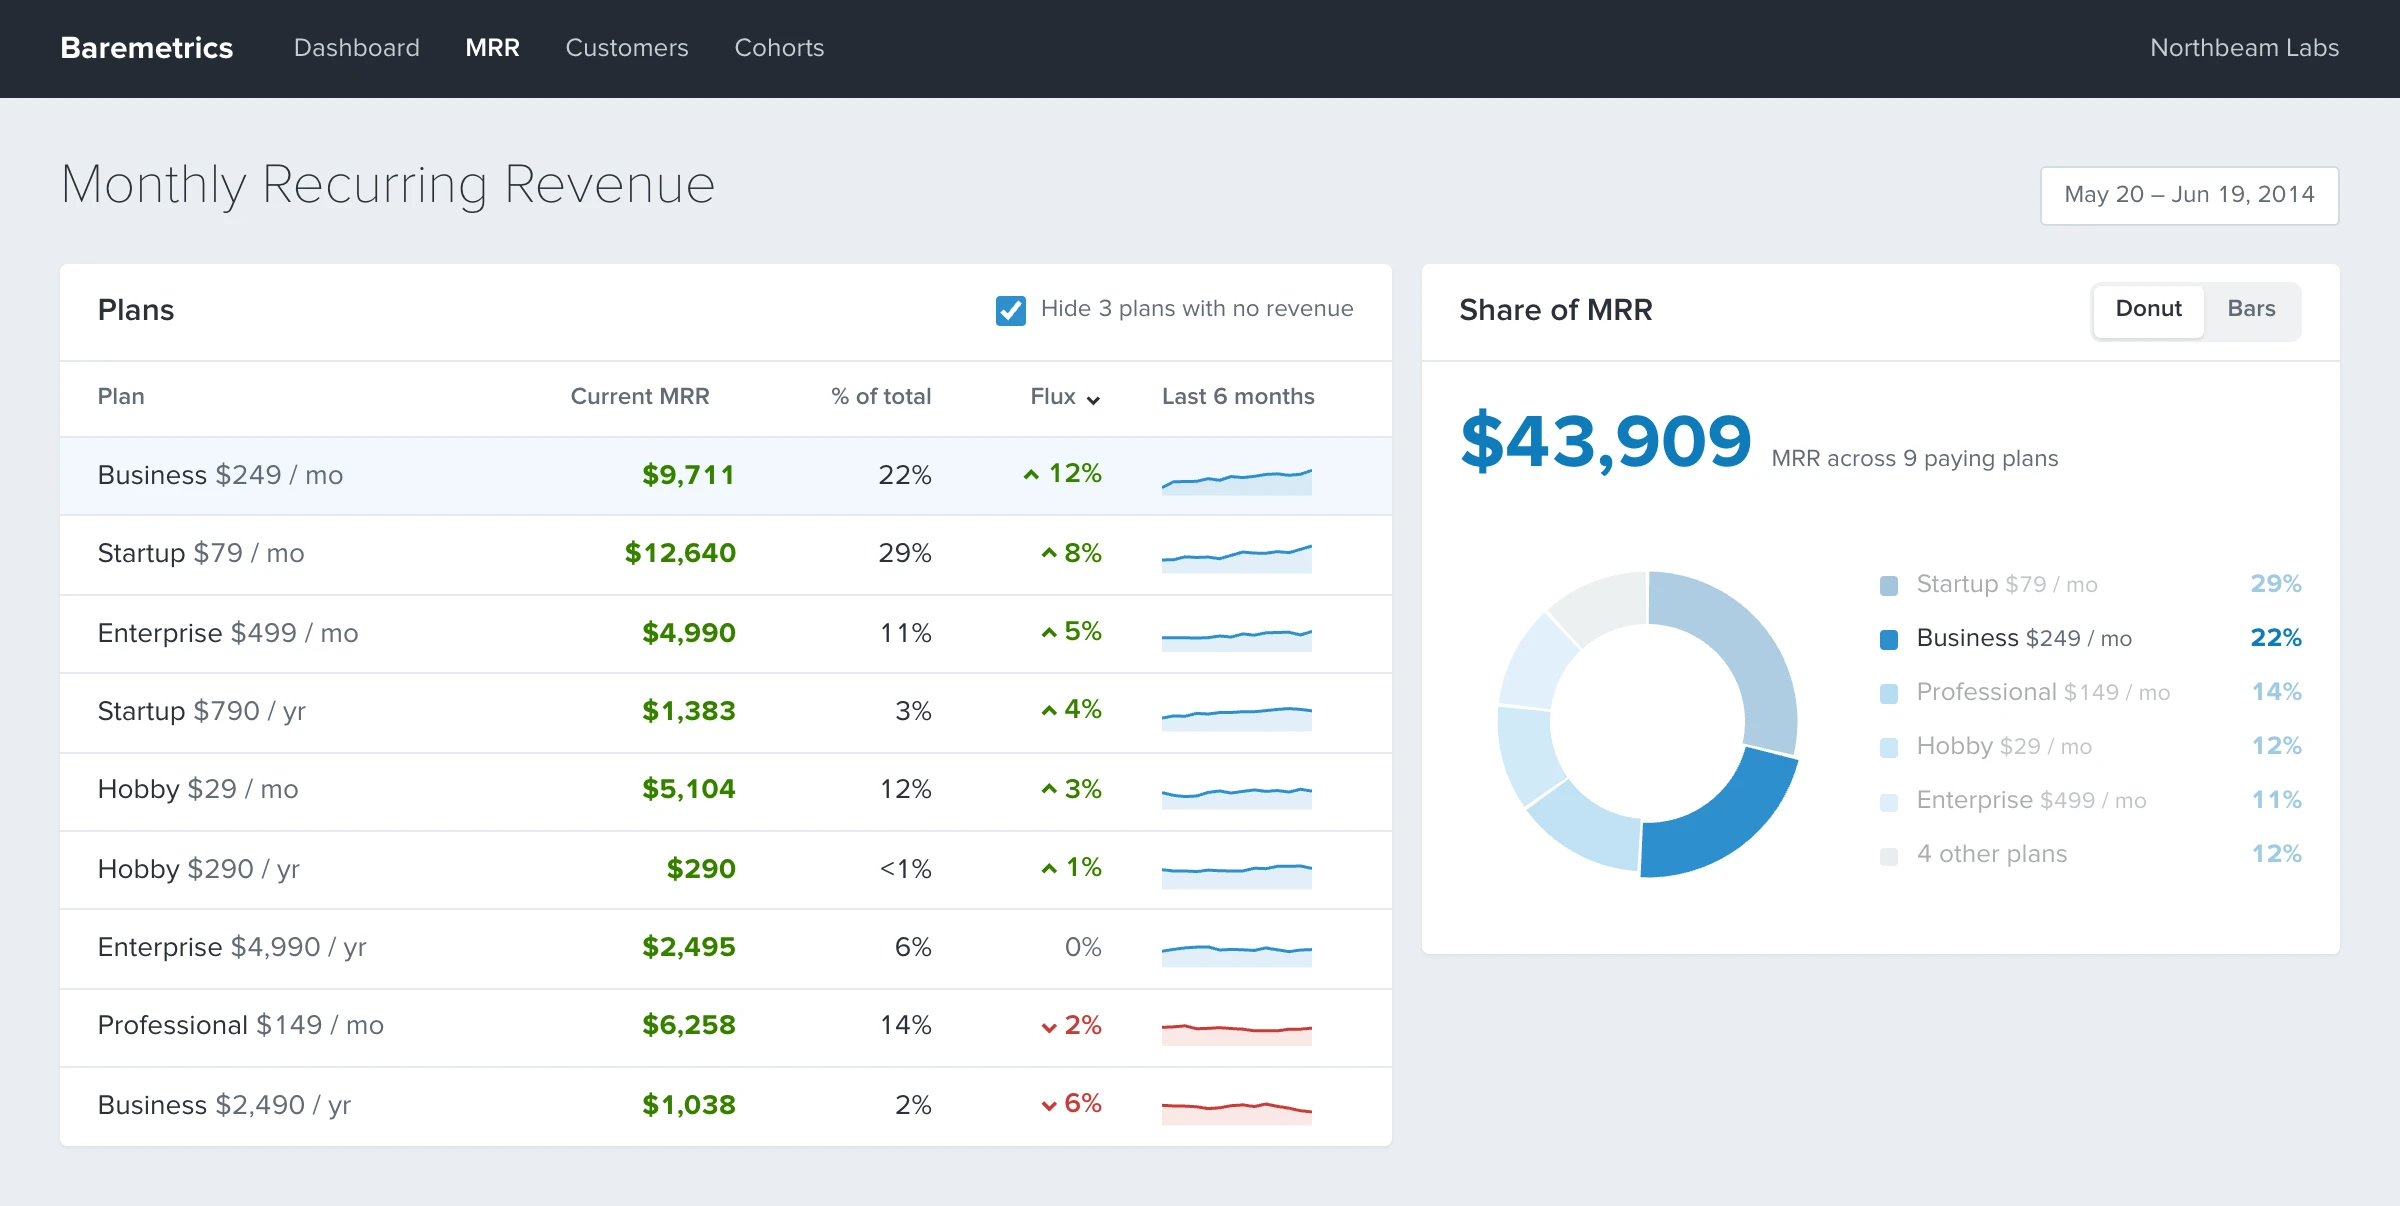
The brief from Baremetrics’ founder, Josh Pigford, was to make plan revenue something you could compare. So the table gained the columns a comparison needs: each plan’s share of the total, its change this month, and a six-month trend. Every column sorts. Plans that earn nothing hide unless you ask for them.
Beside it, one chart answers the question the table can’t answer at a glance: how the whole splits. A switch moves it between bars and a donut. I drew it three ways.
Try it
The table and the chart are one view. Point at a plan and its slice lifts; point at a slice and its row lights. Sort by any column, switch the chart, or show the plans with no revenue.
Past five plans a donut stops reading, so the smallest fold into one grey slice and the table keeps the detail. Every share is that plan’s revenue over the total on the screen, so the table and the chart always agree.
Monthly Recurring Revenue
May 20 – Jun 19, 2014| % of total | Last 6 months | |||
|---|---|---|---|---|
| Startup $79 / mo | $12,640 | 29% | up 8% | |
| Business $249 / mo | $9,711 | 22% | up 12% | |
| Professional $149 / mo | $6,258 | 14% | down 2% | |
| Hobby $29 / mo | $5,104 | 12% | up 3% | |
| Enterprise $499 / mo | $4,990 | 11% | up 5% | |
| Enterprise $4,990 / yr | $2,495 | 6% | 0% | |
| Startup $790 / yr | $1,383 | 3% | up 4% | |
| Business $2,490 / yr | $1,038 | 2% | down 6% | |
| Hobby $290 / yr | $290 | <1% | up 1% |
- Startup $79 / mo29%
- Business $249 / mo22%
- Professional $149 / mo14%
- Hobby $29 / mo12%
- Enterprise $499 / mo11%
- 4 other plans12%
The working prototype plays on a larger screen.
What it trades
Hiding the $0 plans makes the list honest about what pays, and it hides a question a founder might want to ask: why does nobody buy the yearly Professional plan? So the filter says how many it hides, and one click brings them back. Most people never change a default, so the default has to be the view that reads.
Where it landed
I delivered the Plans designs to Josh on June 23, 2014, and the redesign shipped in Baremetrics’ MRR dashboard that year. That November I joined full time to lead design across the product and its website.
- Role
- Design Lead
- Year
- 2014
- Shipped
- Baremetrics’ MRR dashboard, 2014
- Platform
- Web
- Prototype
- Rebuilt from the 2014 design
- Sample data
- The companies, plans and numbers; the June 2014 list is the original