Experimentation Platform
Uber XP
At Uber a feature ramps: behind a flag, to a few people, then more, with an experiment measuring what it does. XP is the platform that runs those ramps. In about three months I redesigned it from two lists into one page per launch, where you can see what a ramp is doing to drivers and take it back as carefully as you shipped it.
Every launch is a bet
A ramp goes to employees first, then one percent of a city, then a quarter of a country. At every step an experiment compares the drivers who have the feature with the drivers who don’t. Uber runs more than a thousand of these at any time, across apps that carry thousands of flags.
When one goes wrong, a driver can’t sign in and doesn’t earn that night. The engineers and I worked from one question: when a launch starts hurting people, how fast can its owner know, and how sure can they be before they pull it?
Two lists, no verdict
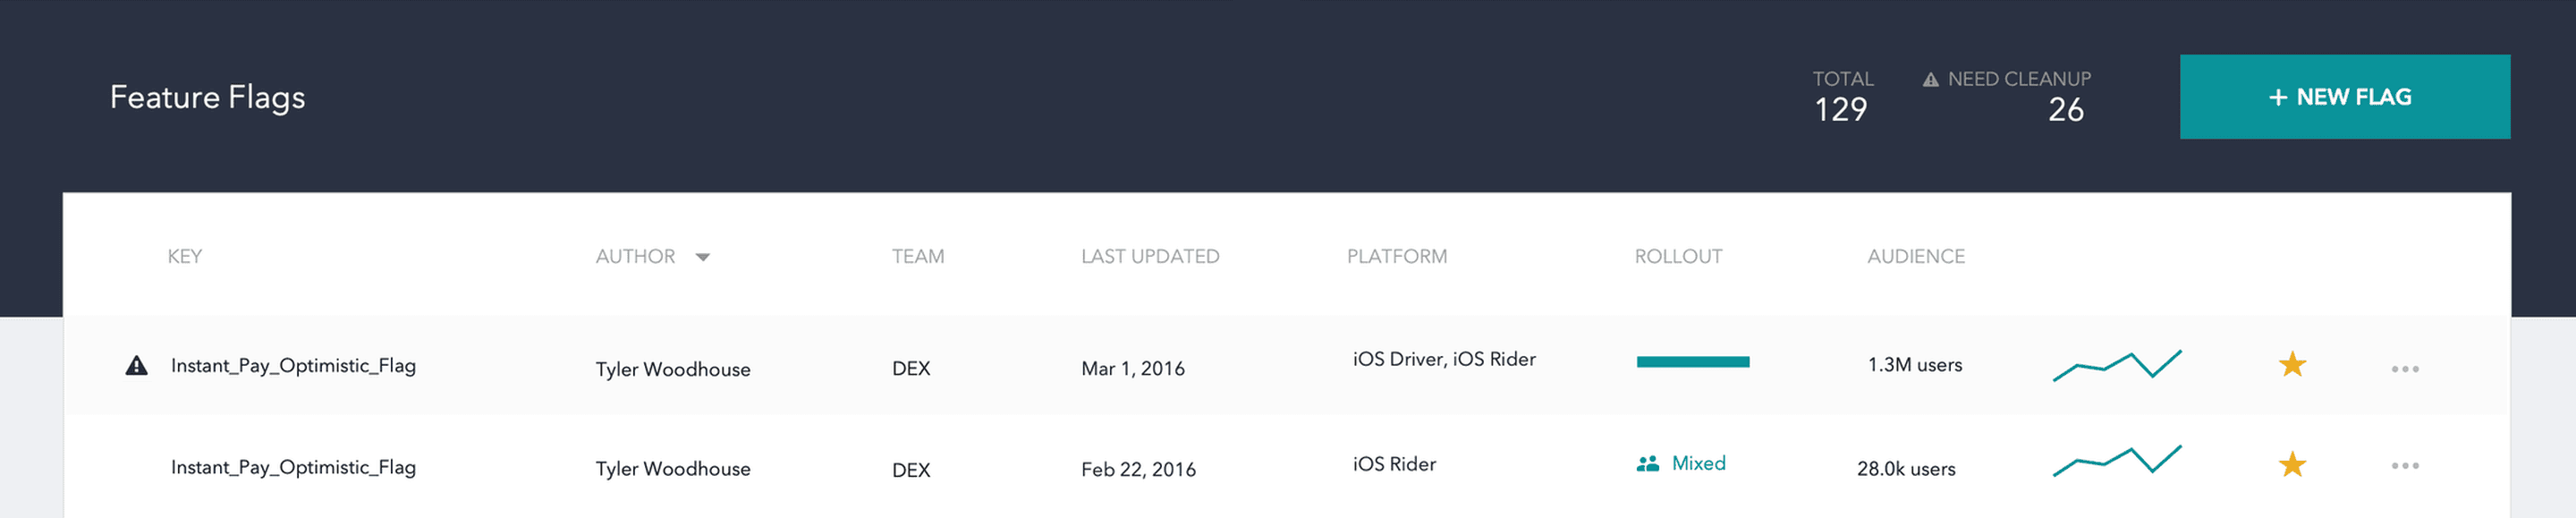
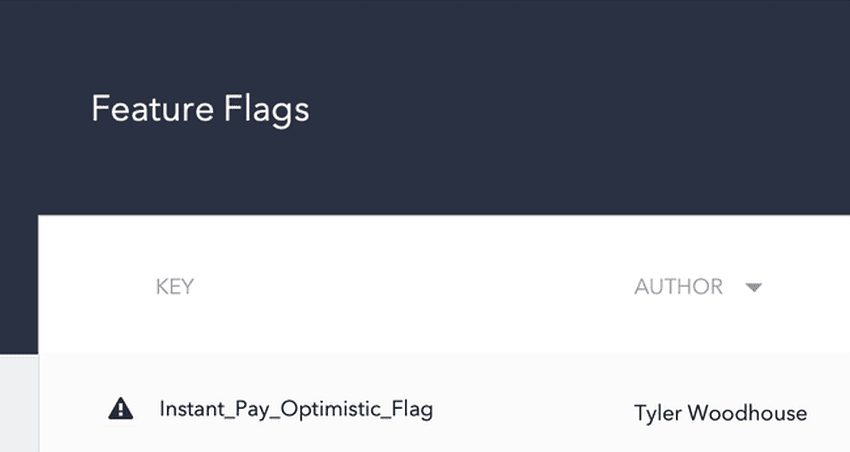
XP began as Morpheus: two lists, every flag and every experiment, each row with an owner, a rollout bar and a sparkline too small to read. It showed what existed and who owned it. Whether any of it was hurting anyone, it could not say.
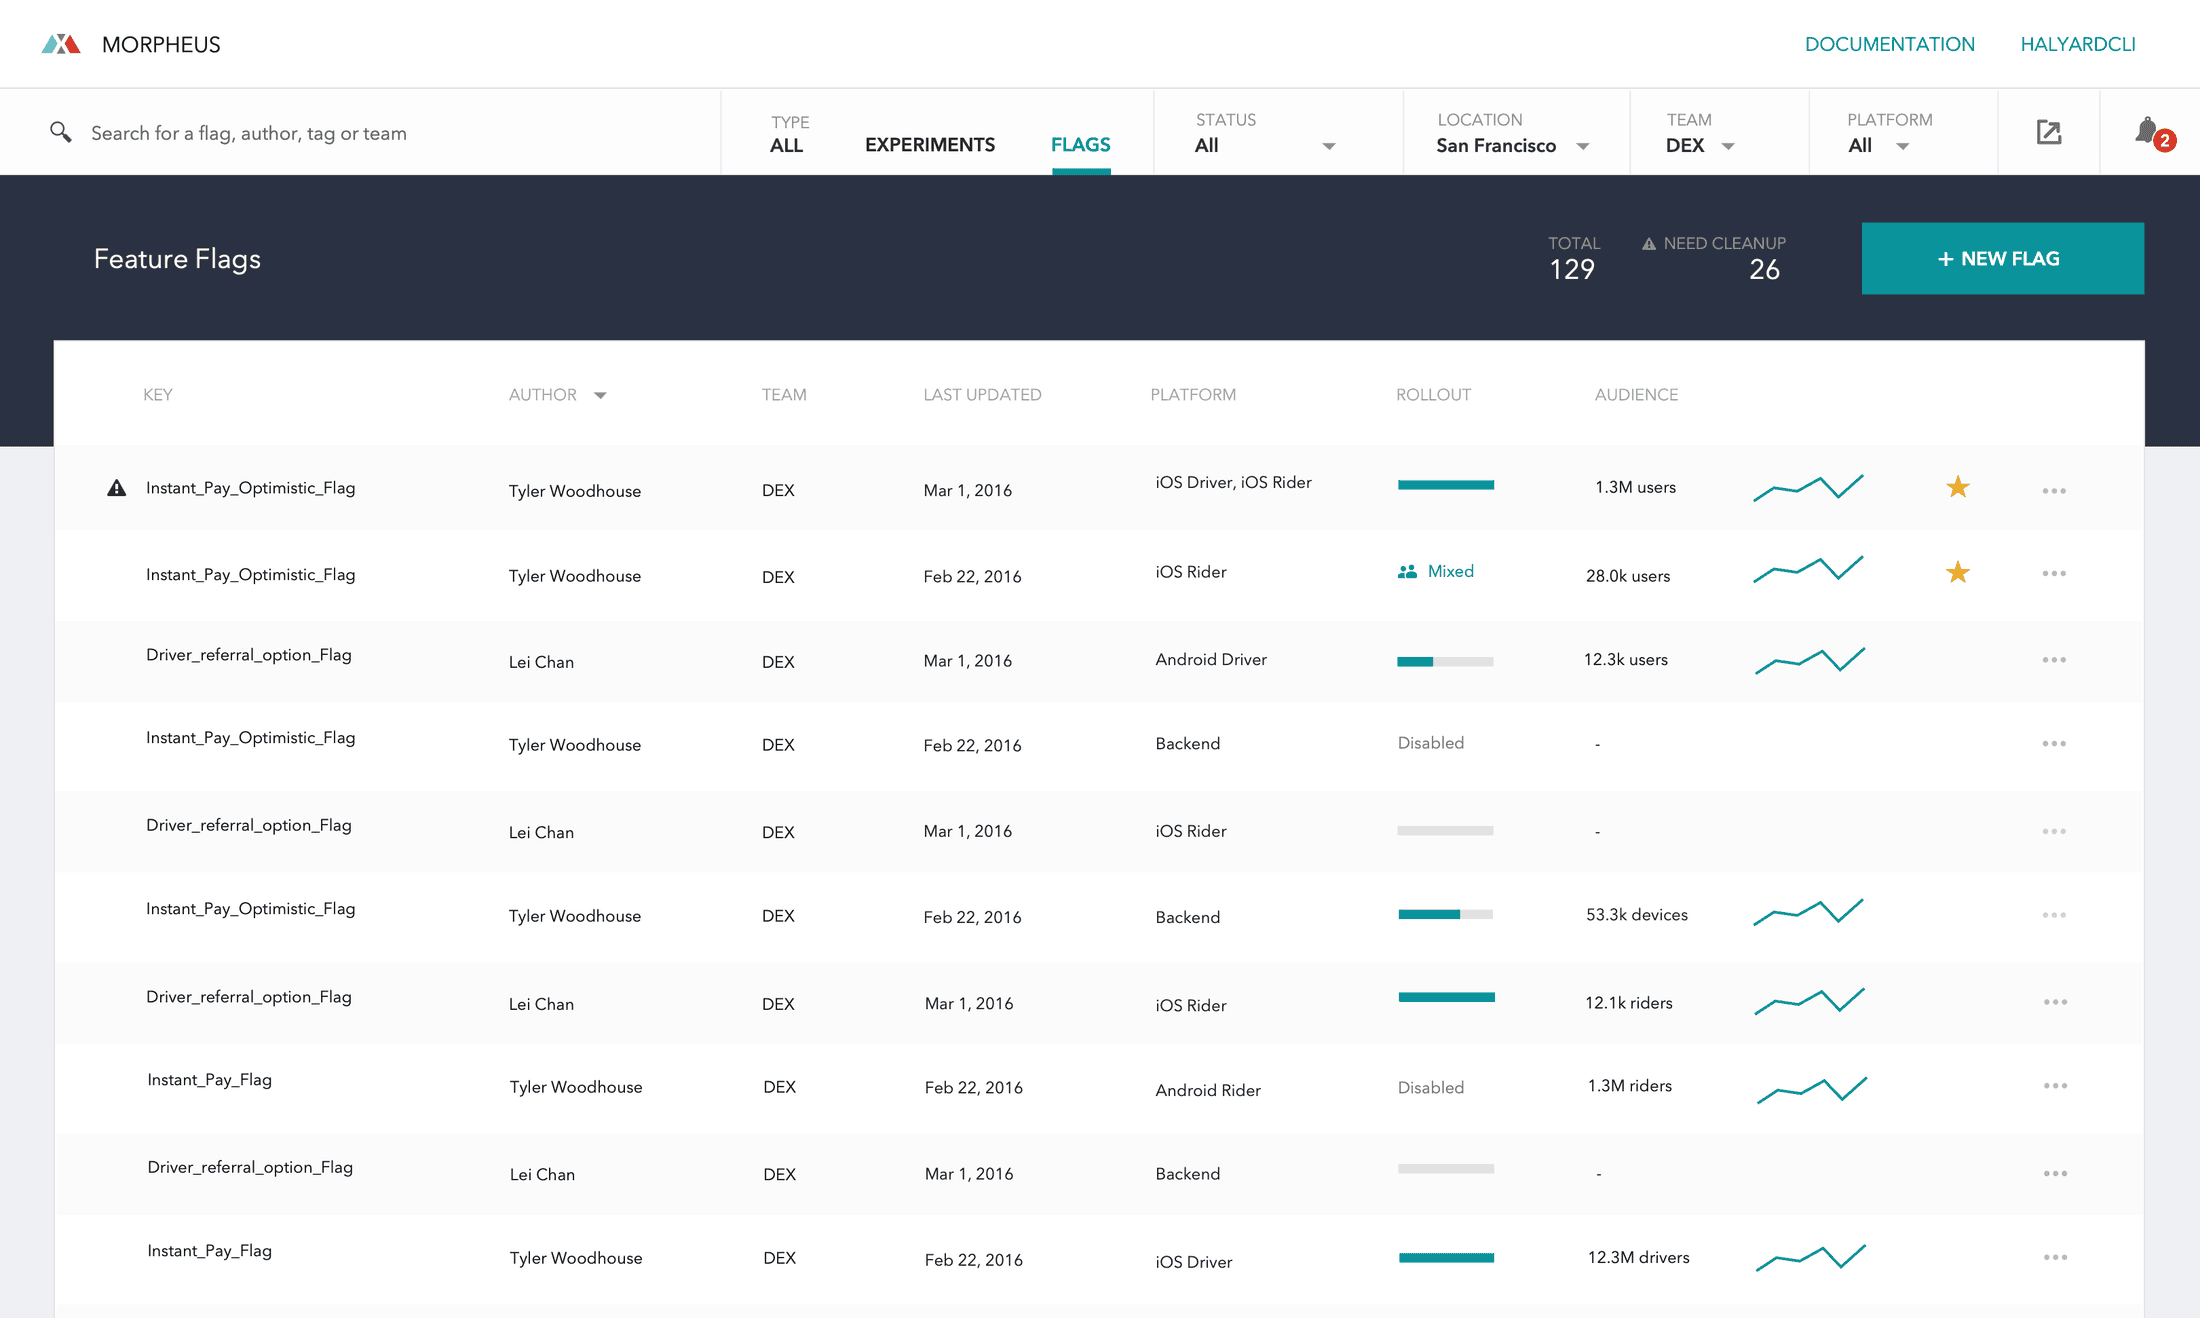
My first pass gave launches stages and a number for their blast radius, and put both in the wrong place. The stages lived in a sidebar and the evidence in a panel, so what we shipped and what it did to drivers sat on opposite sides of the screen.
The flag is the page
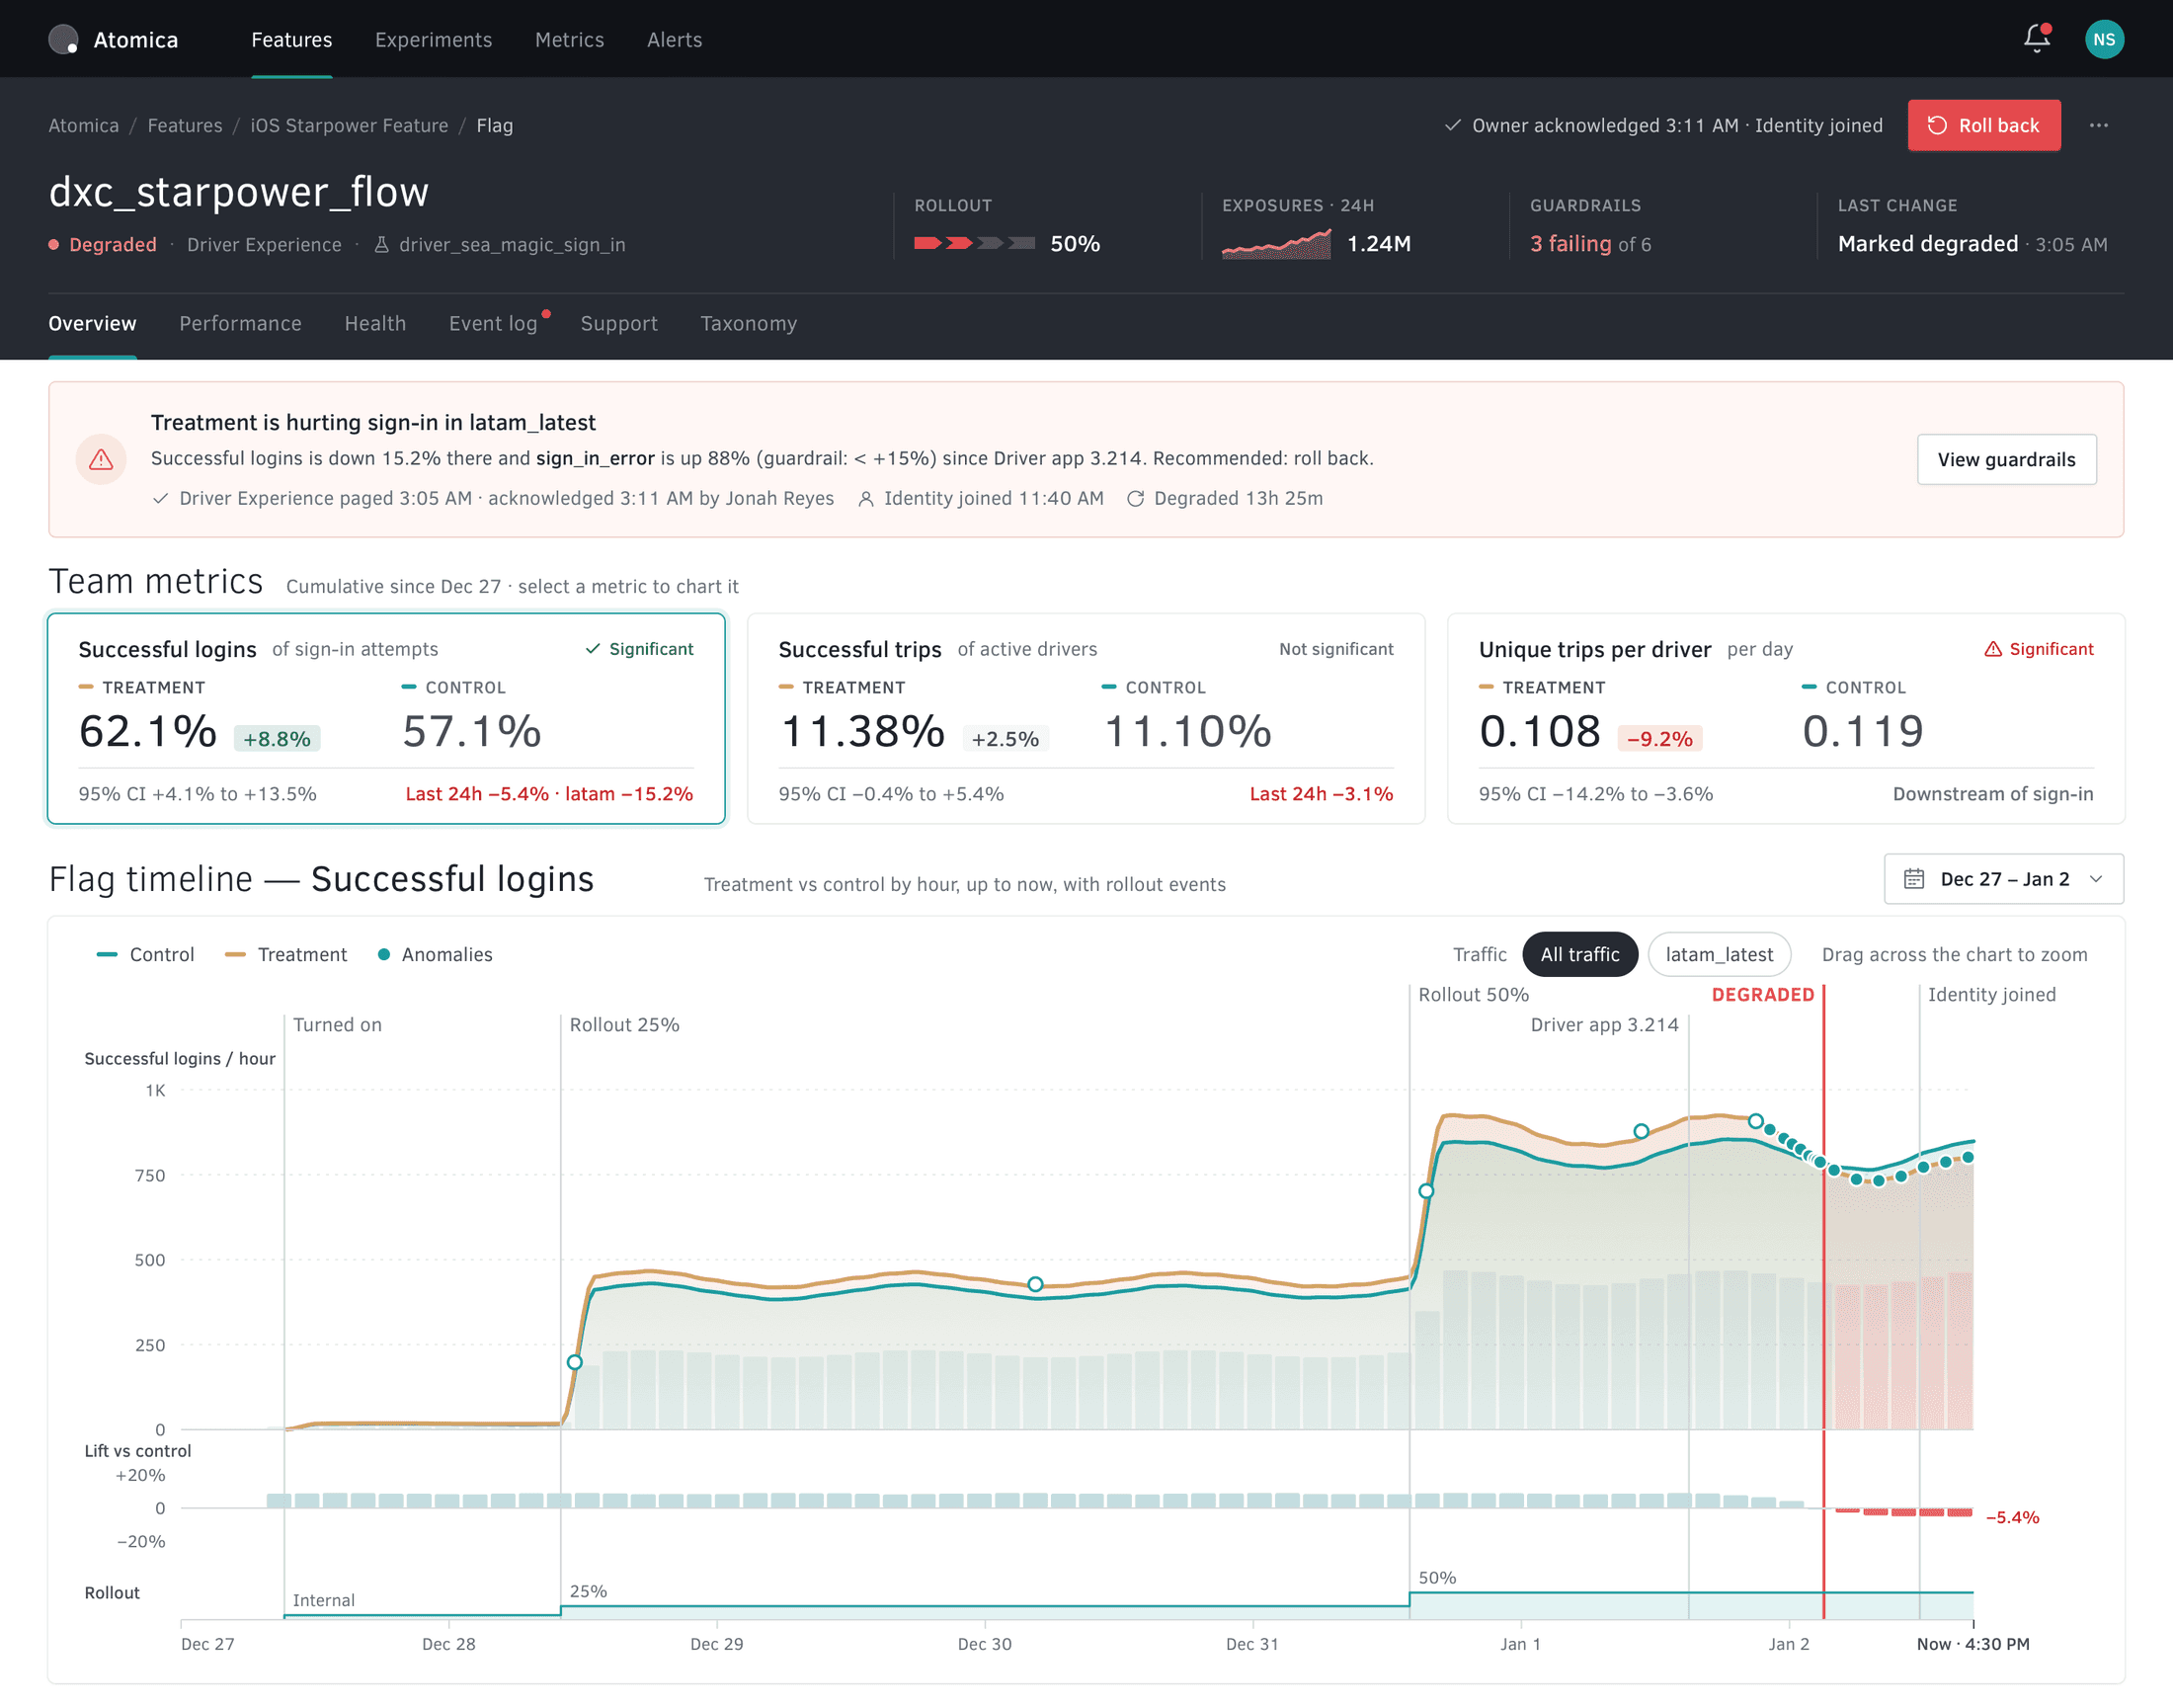
The redesign was code-named Atomica. I threw out the lists and made the flag the page. It opens on a sentence, not a chart: “Treatment is hurting sign-in in latam_latest.”
- Before
- After
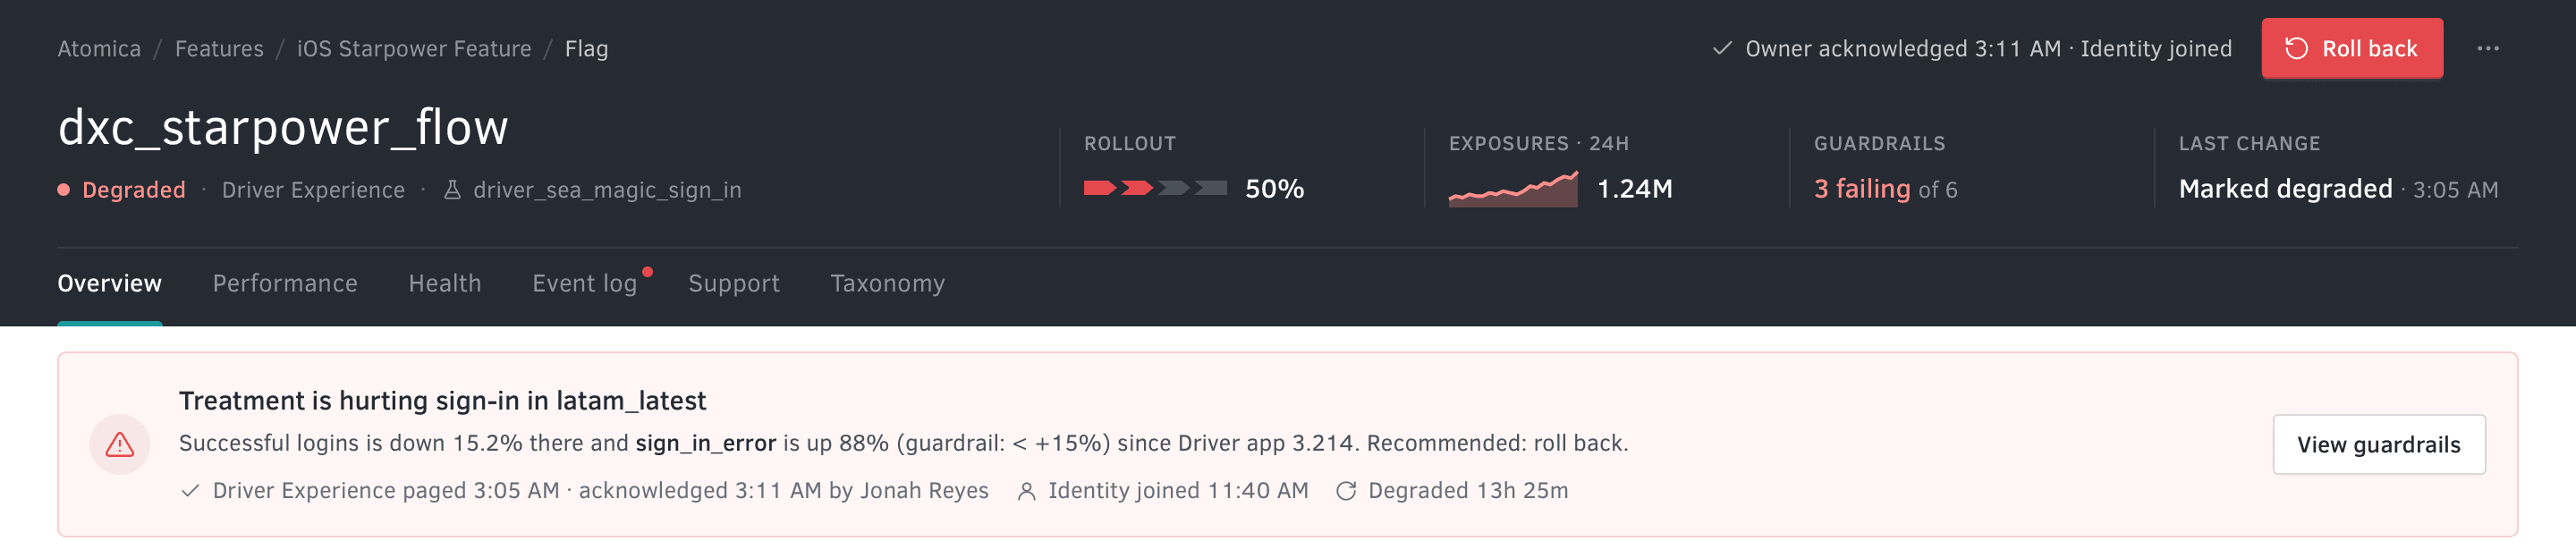
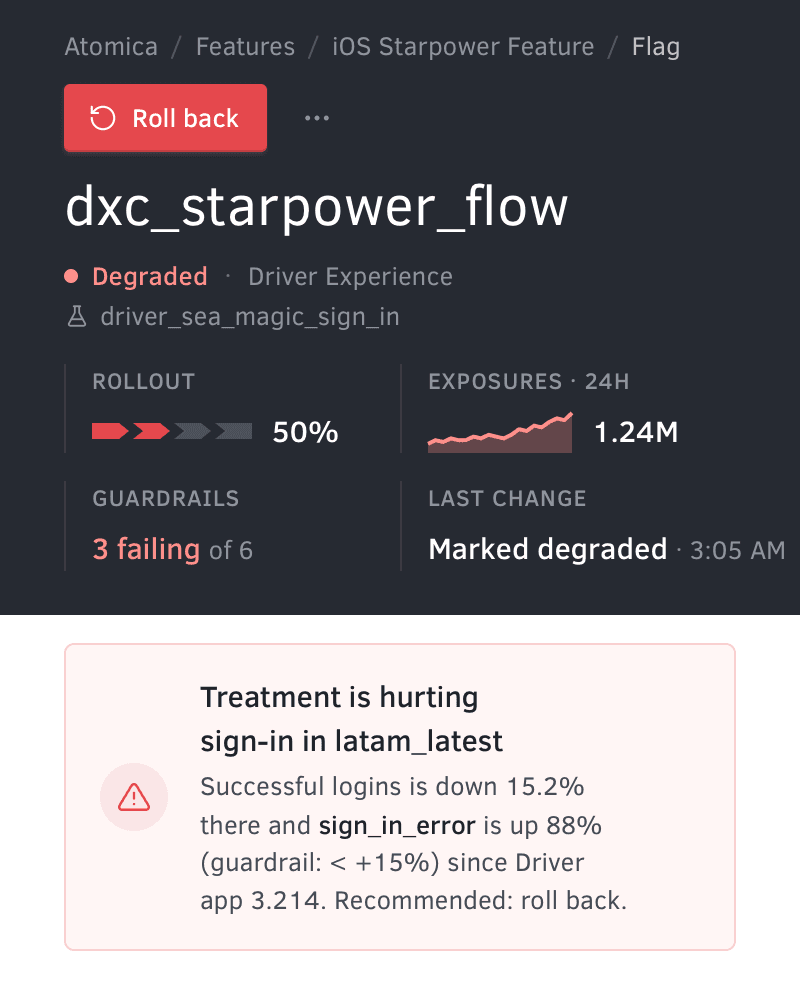
Under it sits what the system knows: when it started, what shipped just before, which error is up and by how much, who has been paged, and what to do. An engineer paged at 3 a.m. should know whether to act before reading a single axis.
Cause and effect, one axis
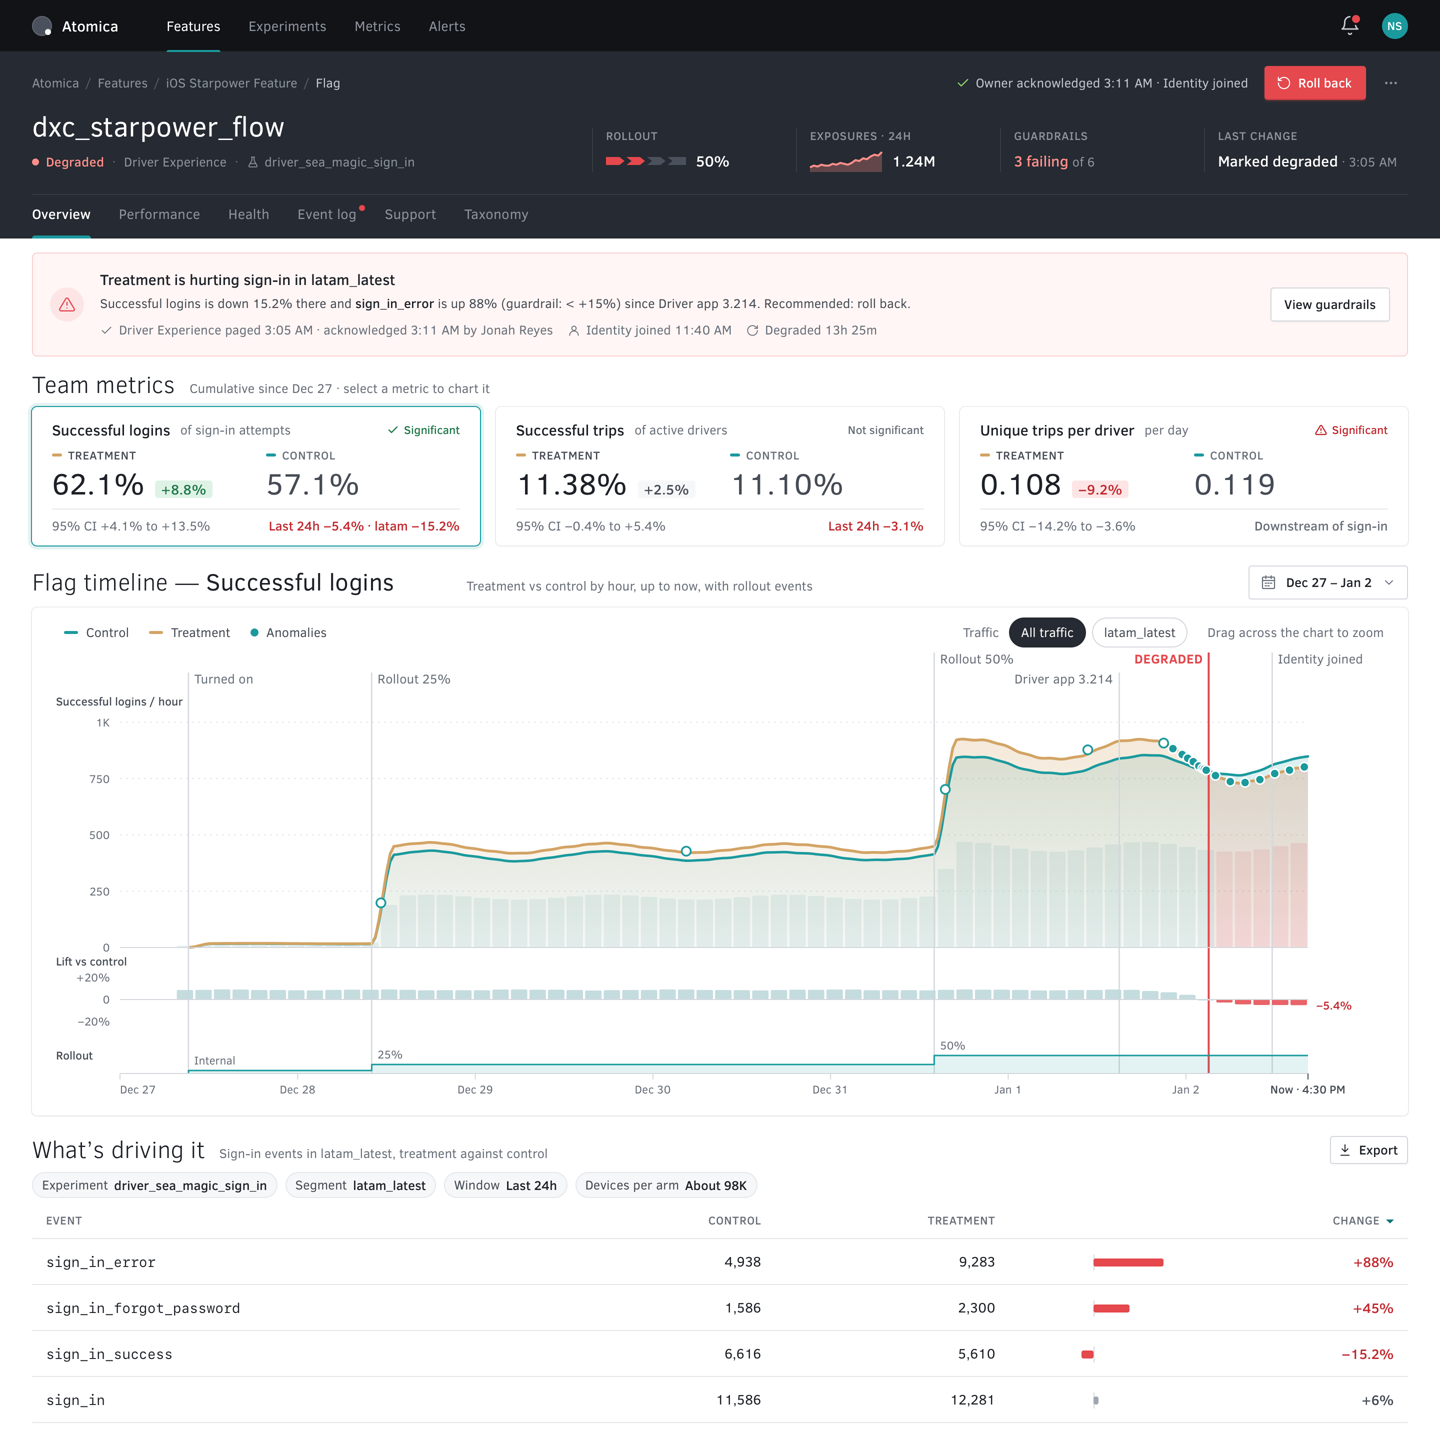
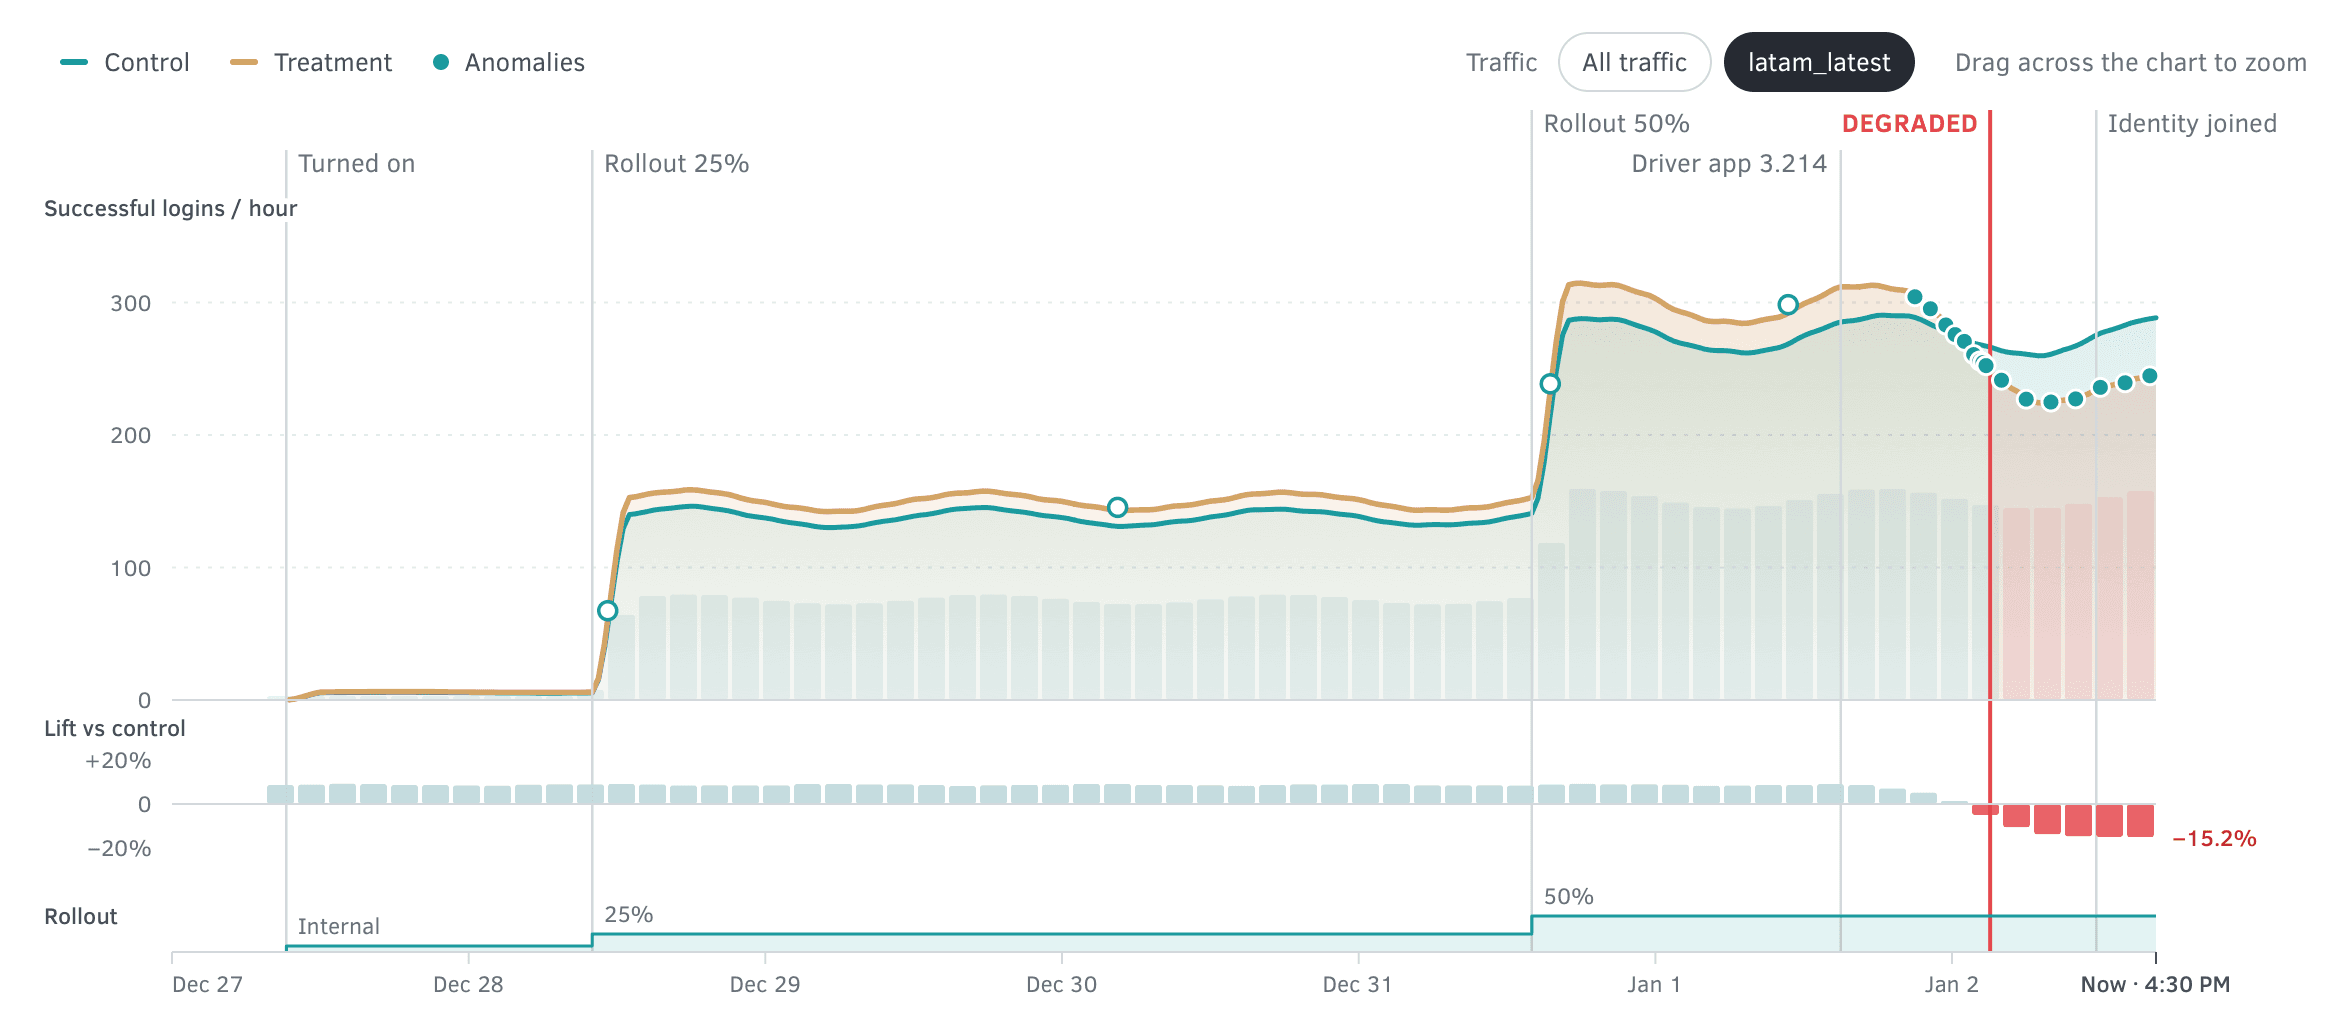
Below the numbers is one timeline, with every ramp, the app release and the page to the team drawn on the metric’s own line. Nobody has to line up a deploy log against a dashboard by eye.
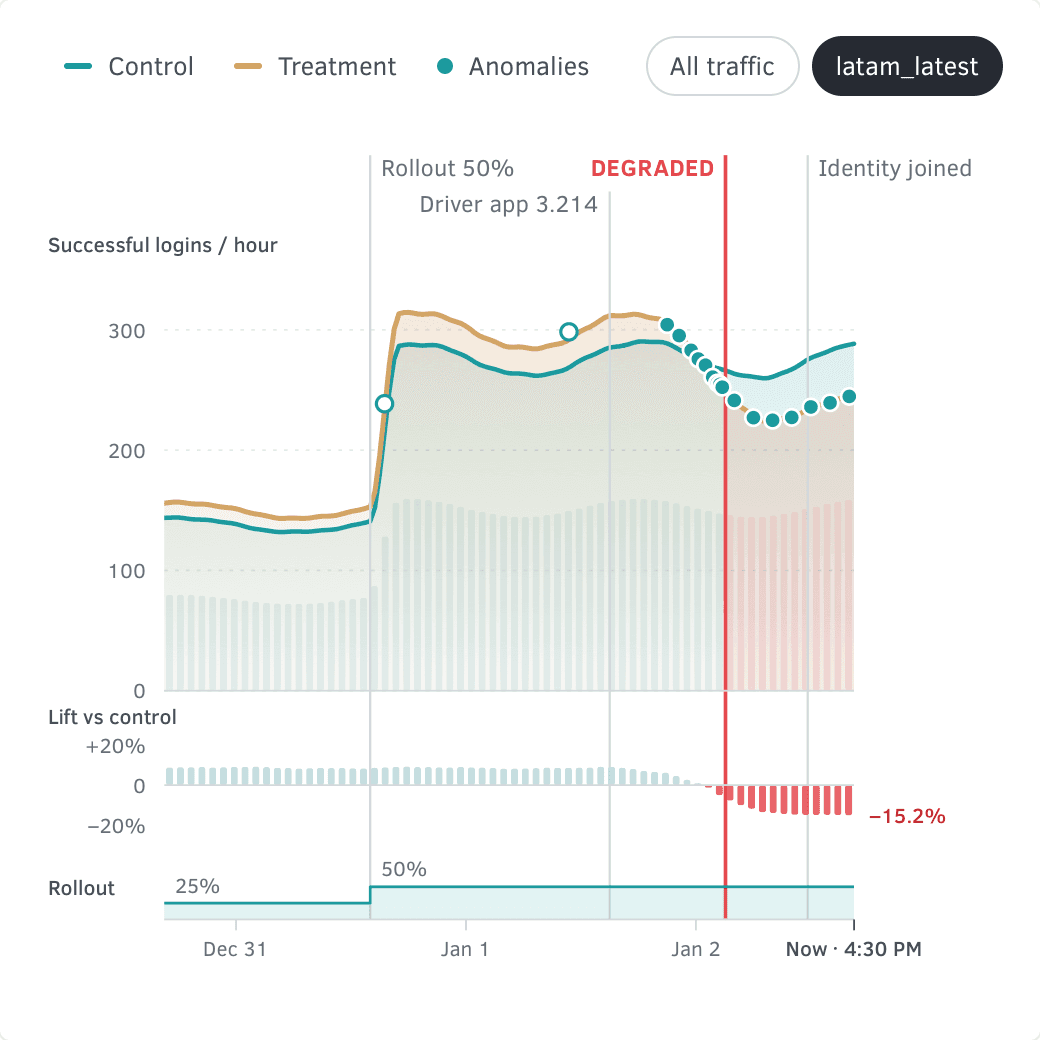
- AnomaliesWindows the system flagged.
- EventsWhat shipped, broke, and who came.
- Treatment and controlLogins an hour, shaded.
- BarsExposure, lift and rollout.
- Grid and scaleLogins, lift, rollout; the days.
The timeline for latam_latest, taken apart into the five layers it is drawn in, each layer’s labels on its own sheet.
Find the cause
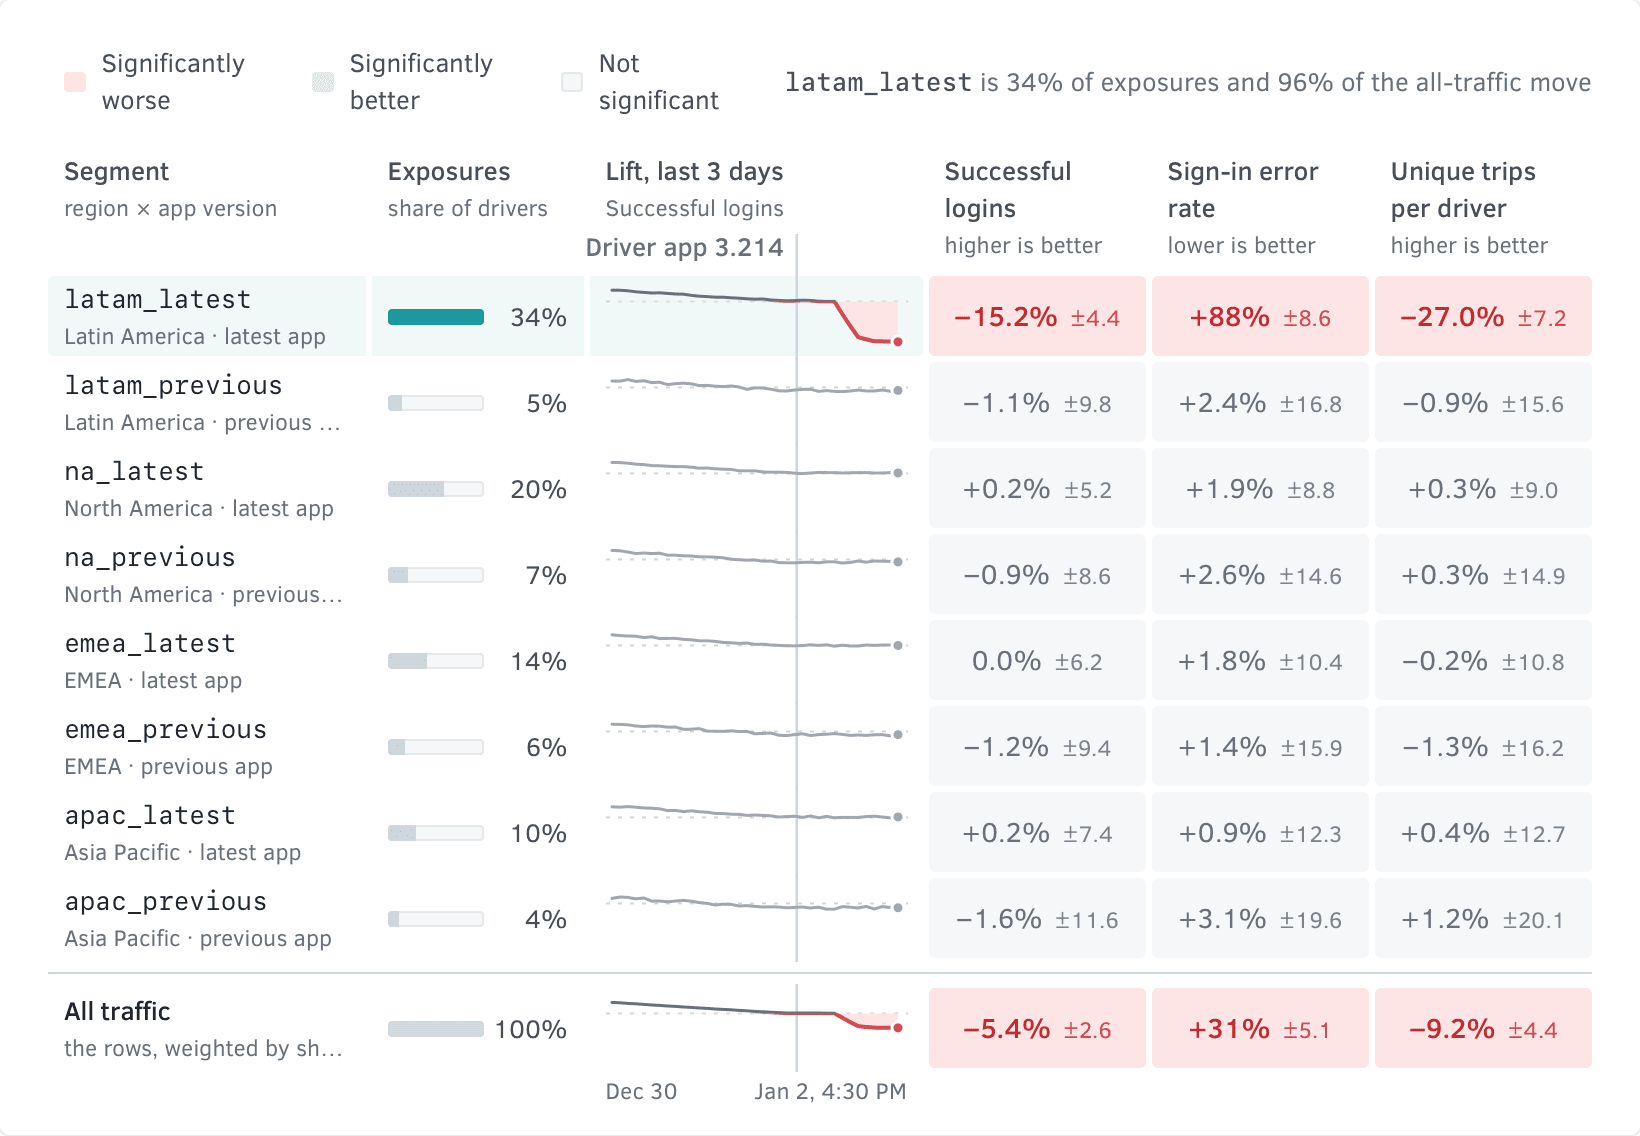
The hardest incident to catch is the one the headline hides. Since this flag went on, successful logins are up 8.8%, and the result is significant. Over the last 24 hours they are down 5.4%. In latam_latest they are down 15.2%. So the timeline has one switch: all traffic, or the segment that is hurting.
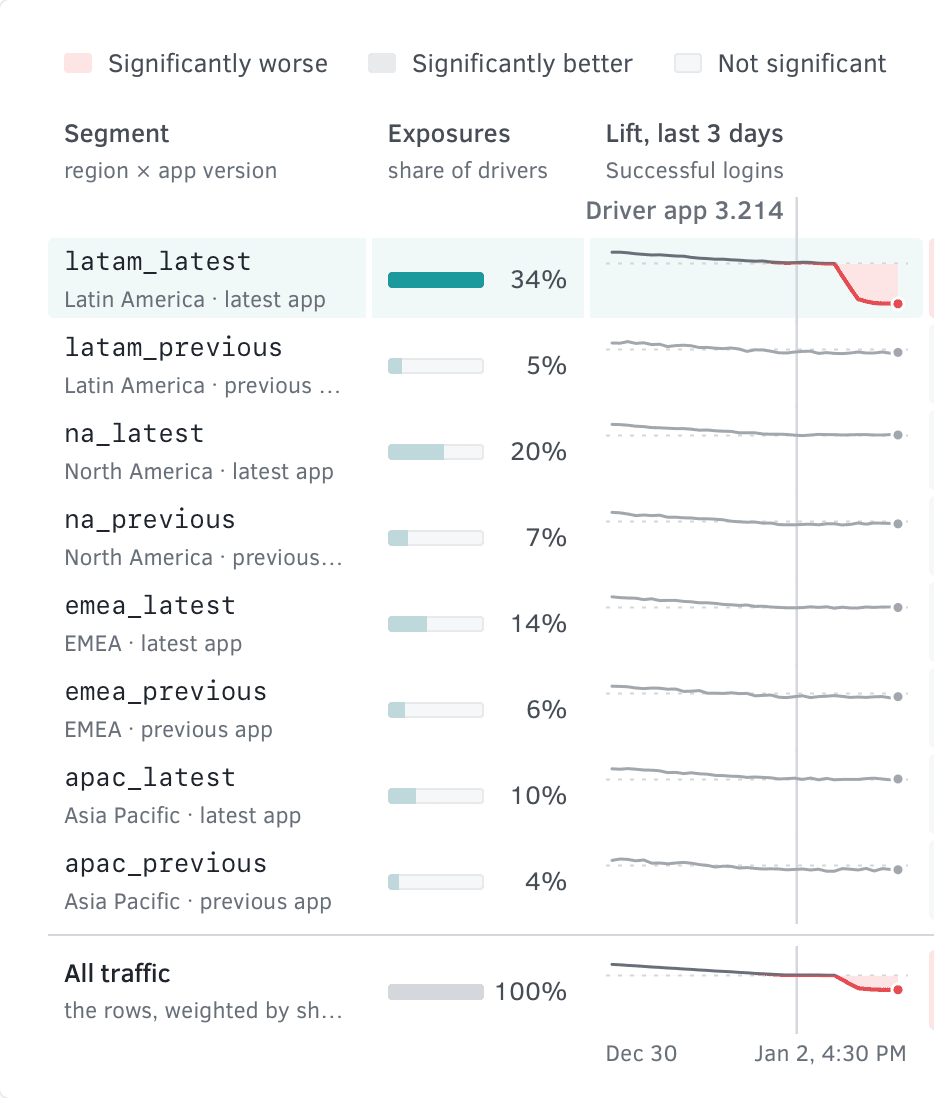
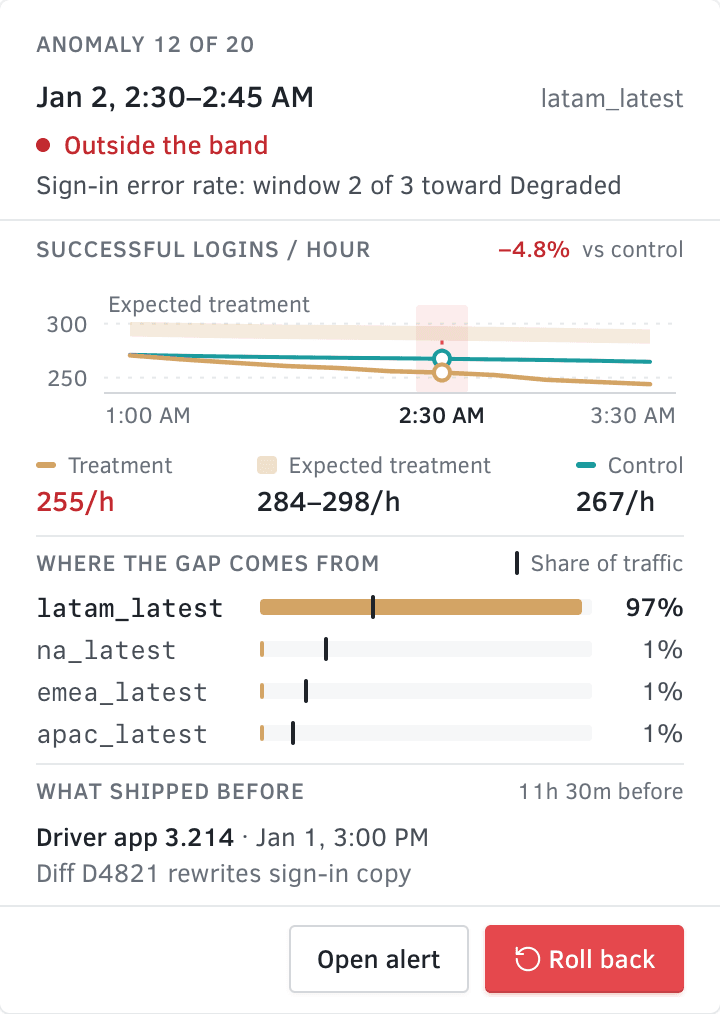
The segments view says where. It sets every region and app version against every metric, shaded only where the difference is significant. Only latam_latest lights up. The row under it is the same region on the previous app, and those drivers are fine, which points at the release. Every dot on the timeline is a 15-minute window the system flagged. Open one and the chart makes room for a panel beside it: what that window did against what was expected, which segment the gap came from, and what shipped just before.
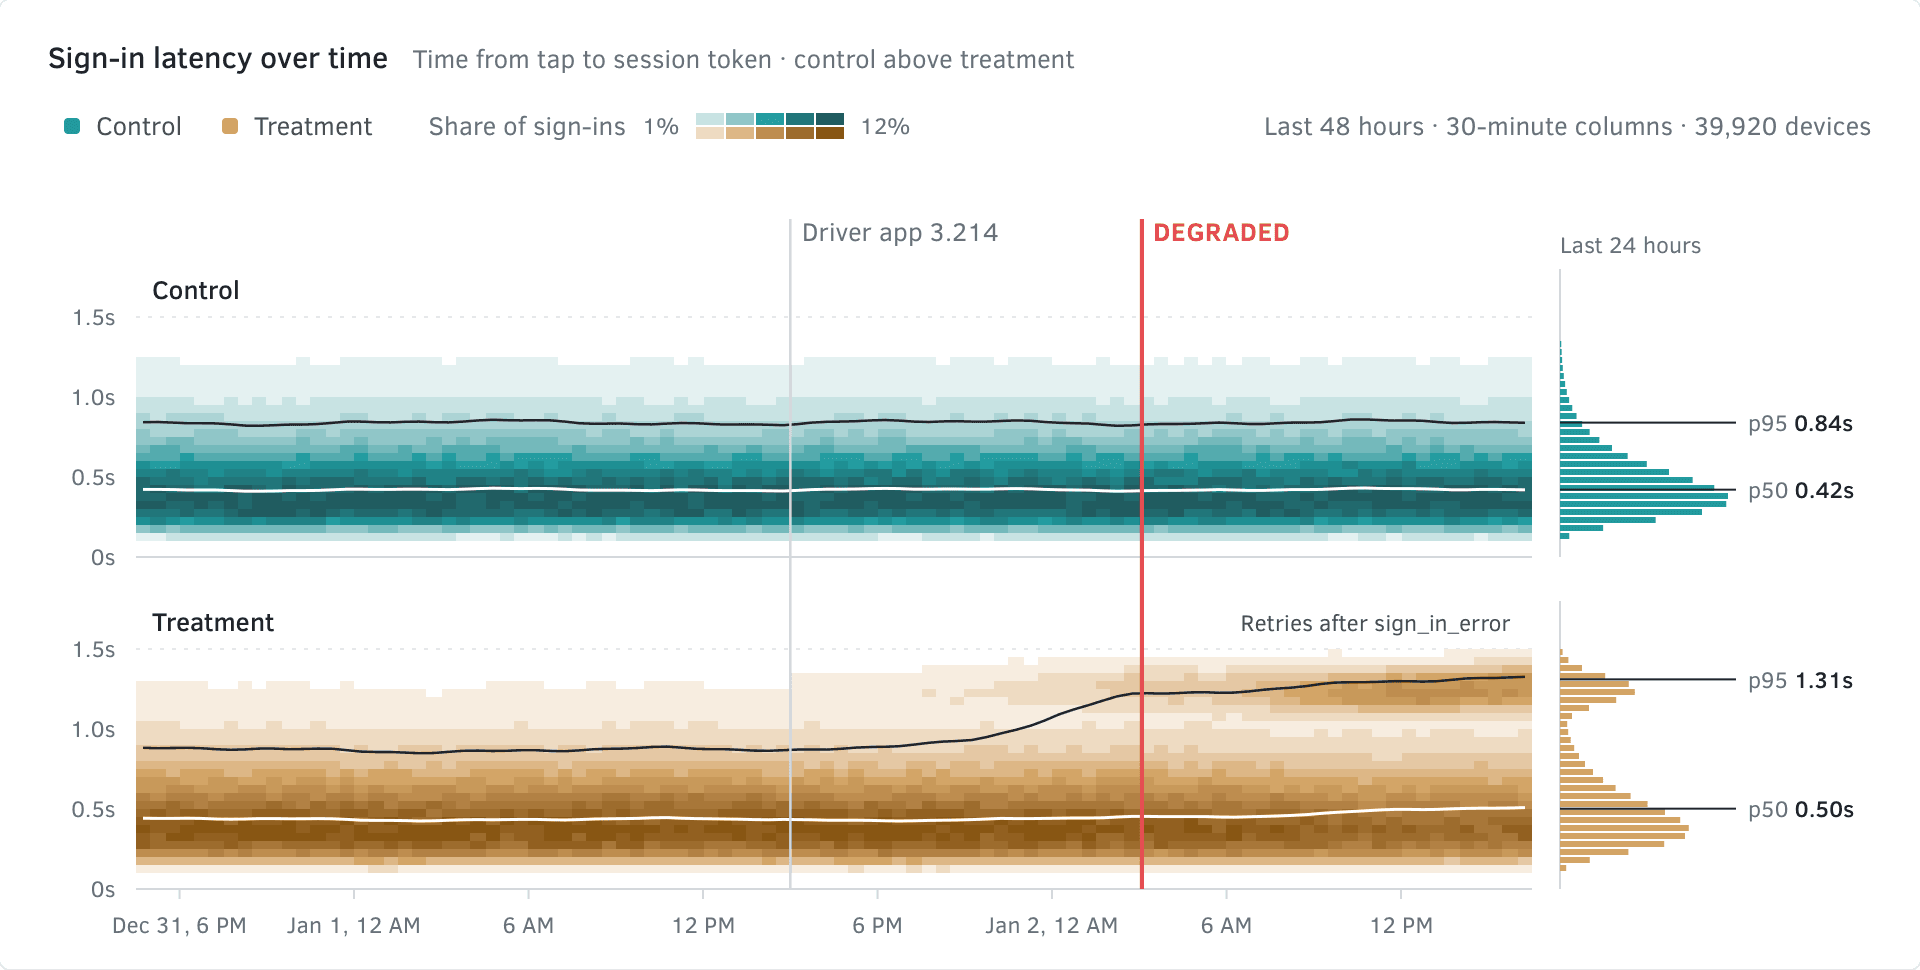
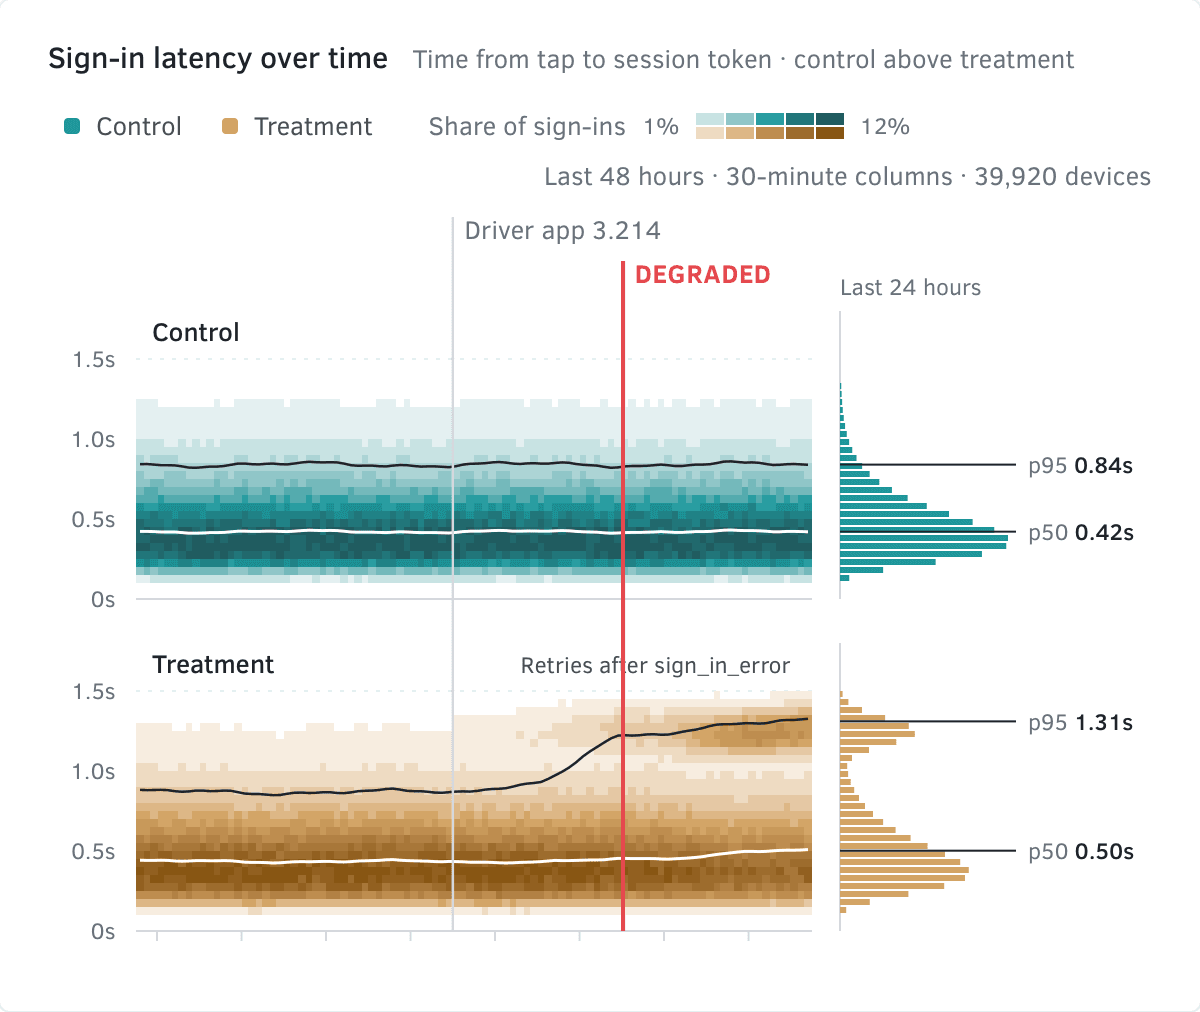
The last step is why. The performance view shows sign-in latency over time, one strip for each group. After the release, treatment grows a second band about a second out. Control never does. That band is drivers trying again after an error.
Undo has a size
In my first pass, undo was a red Revert button at the bottom of a panel, with no word on what it would do. A rollback changes what hundreds of thousands of people see, so I designed it like a launch. You pick how far, and the dialog redraws what that means: 617,000 drivers back to control, or 210,000 in the one segment that is hurting while 407,000 stay in treatment. It says what happens to the experiment and to the alert. Then you type the flag’s name. A wrong click here is a second incident.
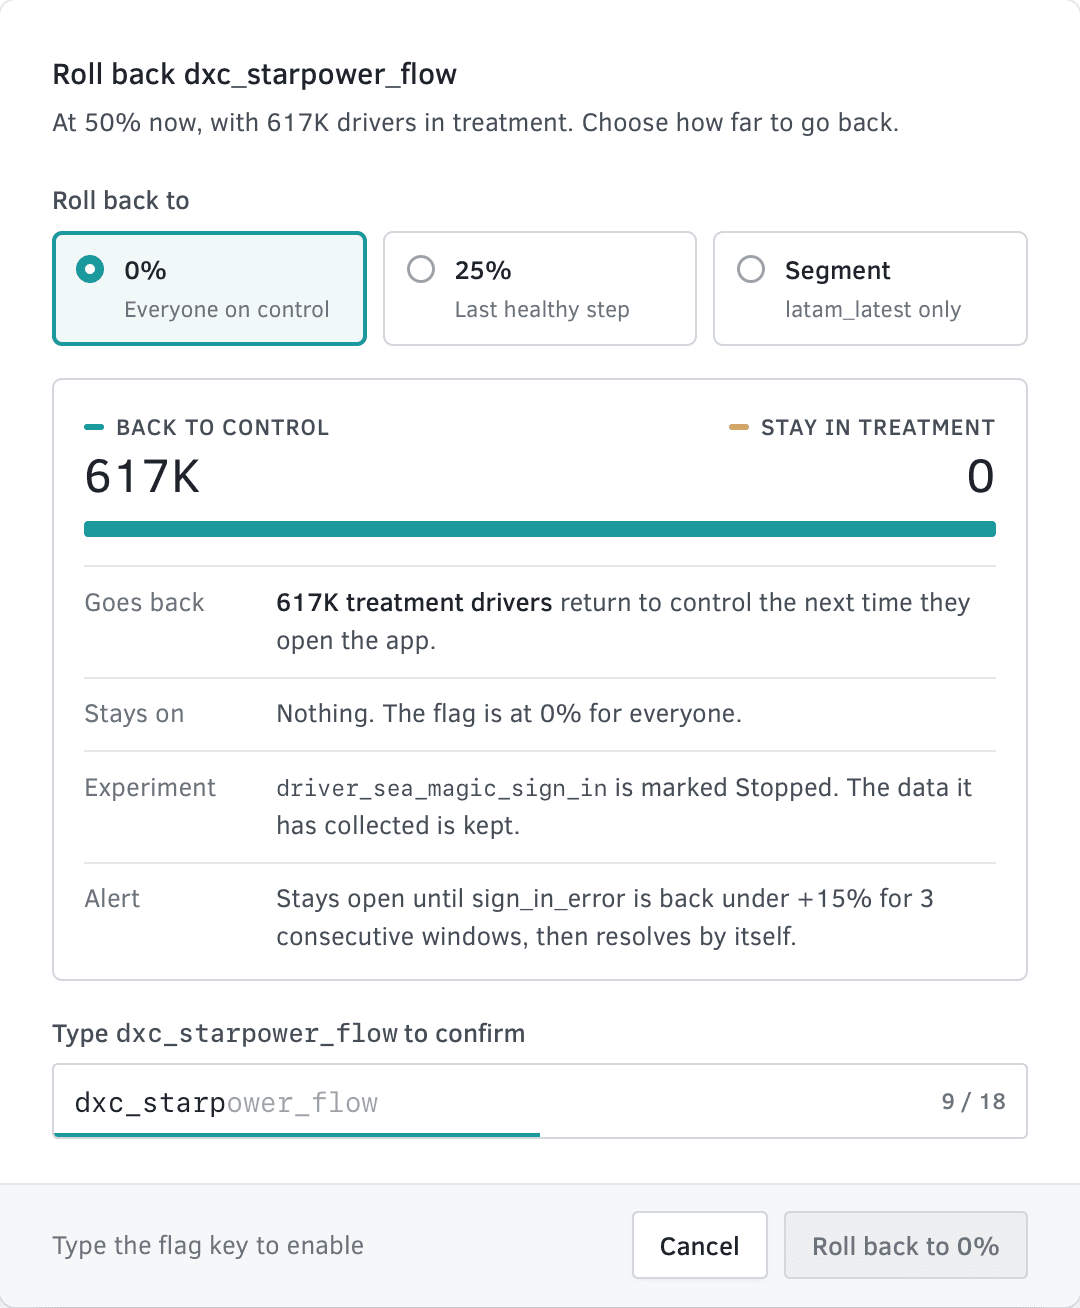
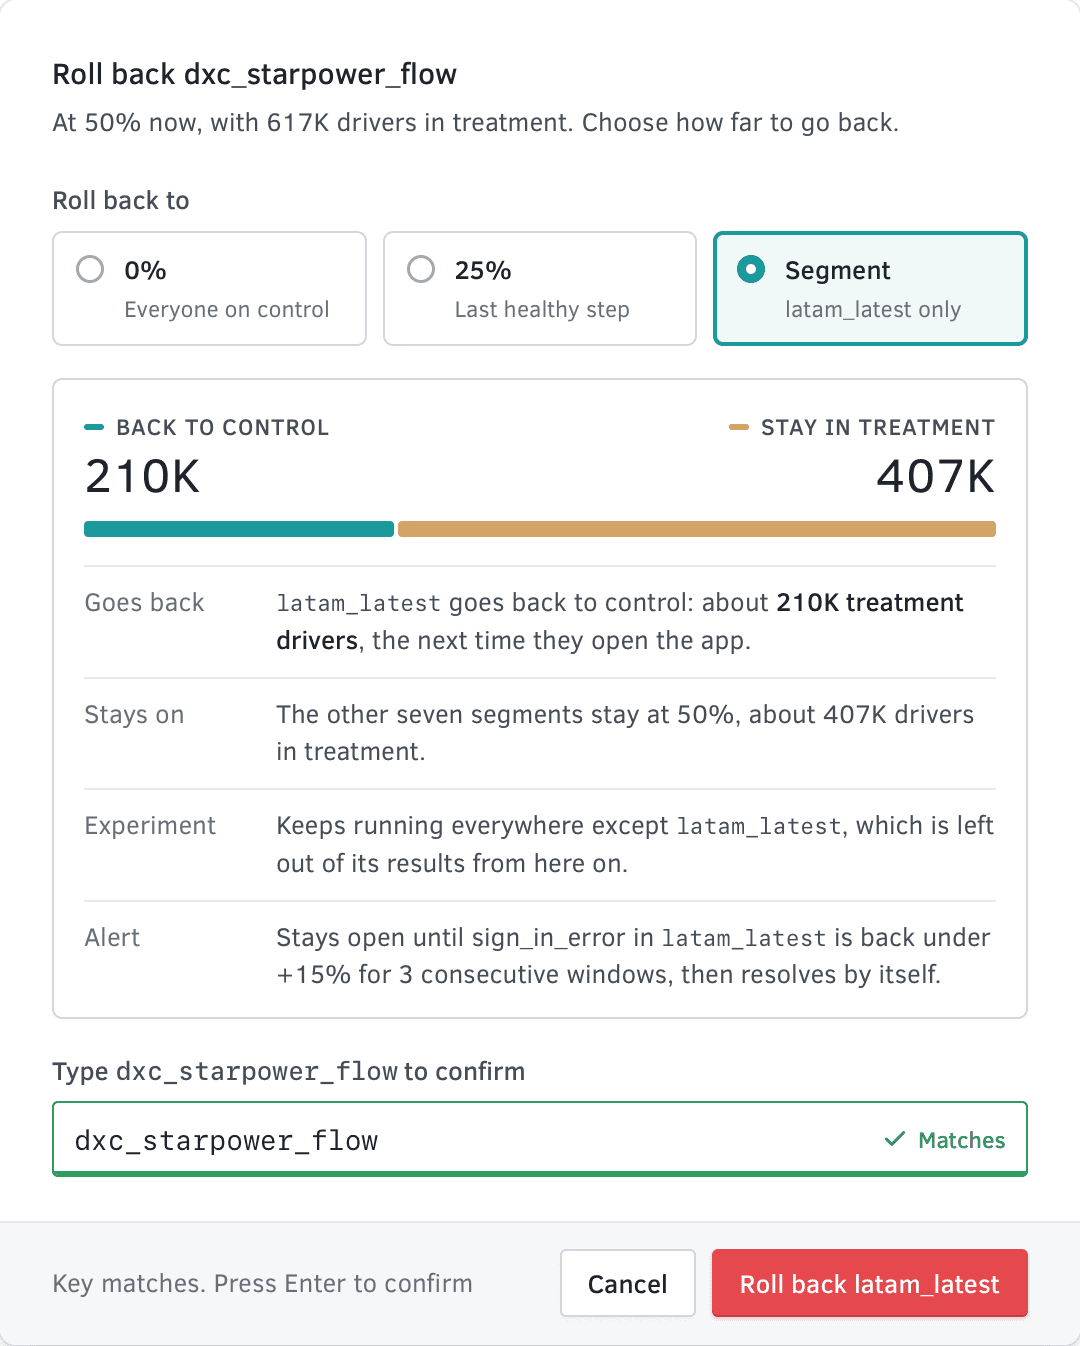
I have carried one idea from this dialog into everything since: show the consequence before the commitment. It is the rule behind AI needs receipts, and most of what designing for operators comes down to.
The policy is on the page
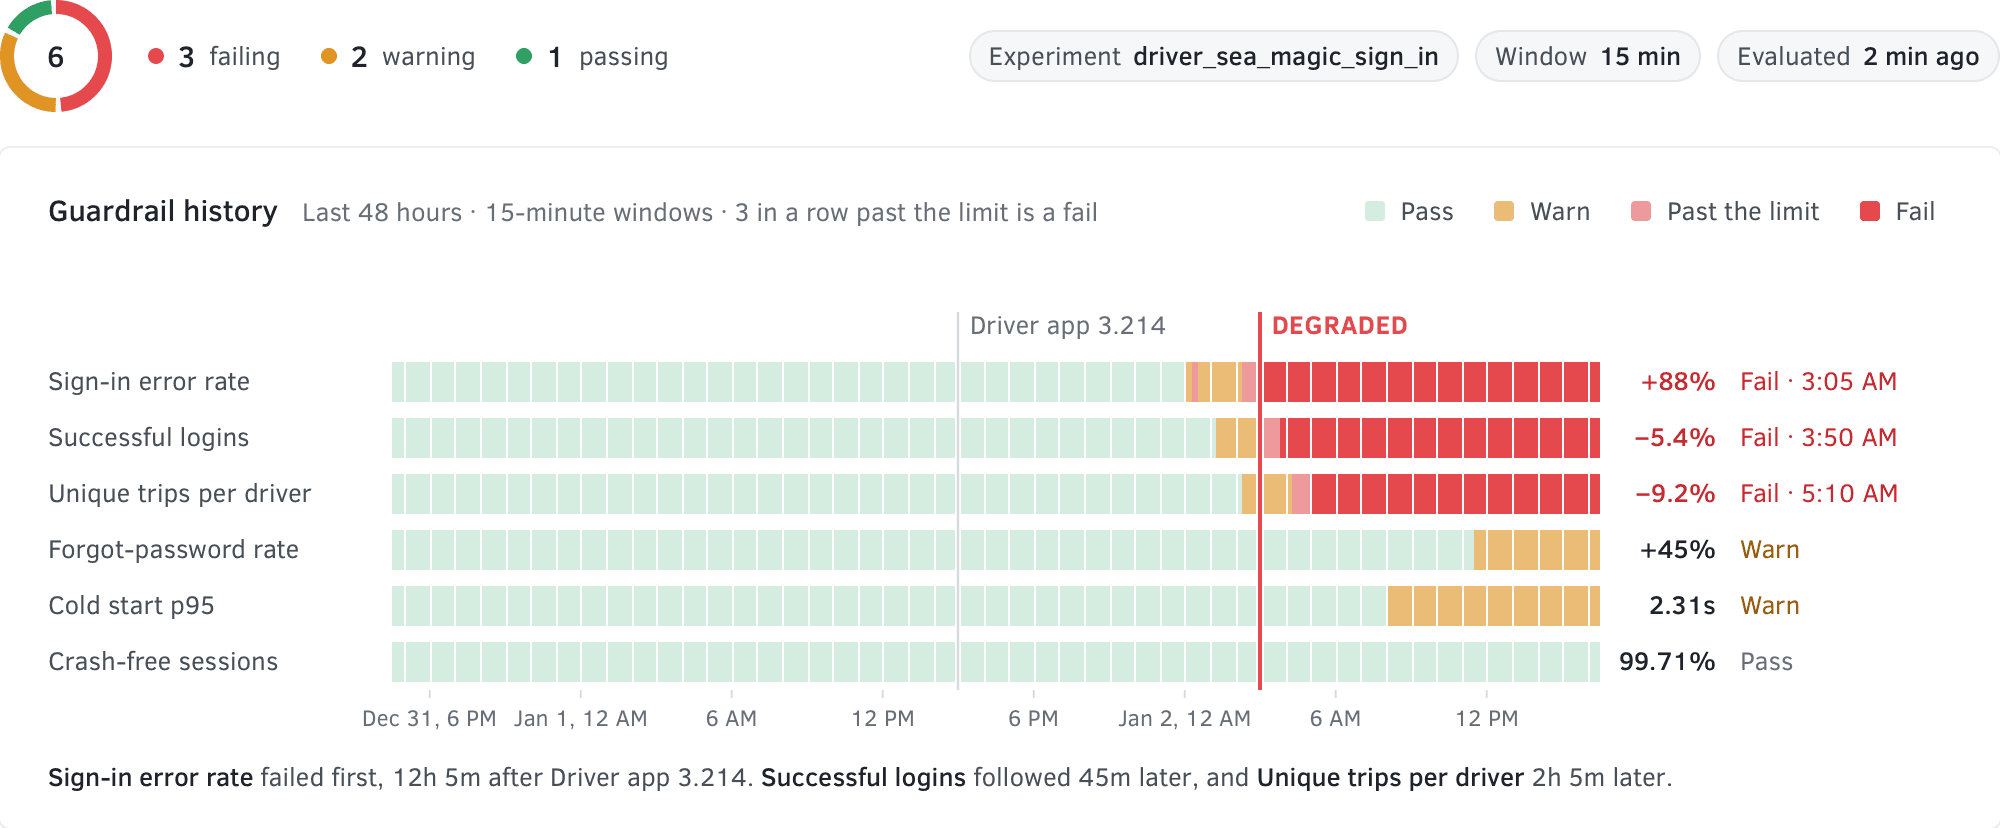
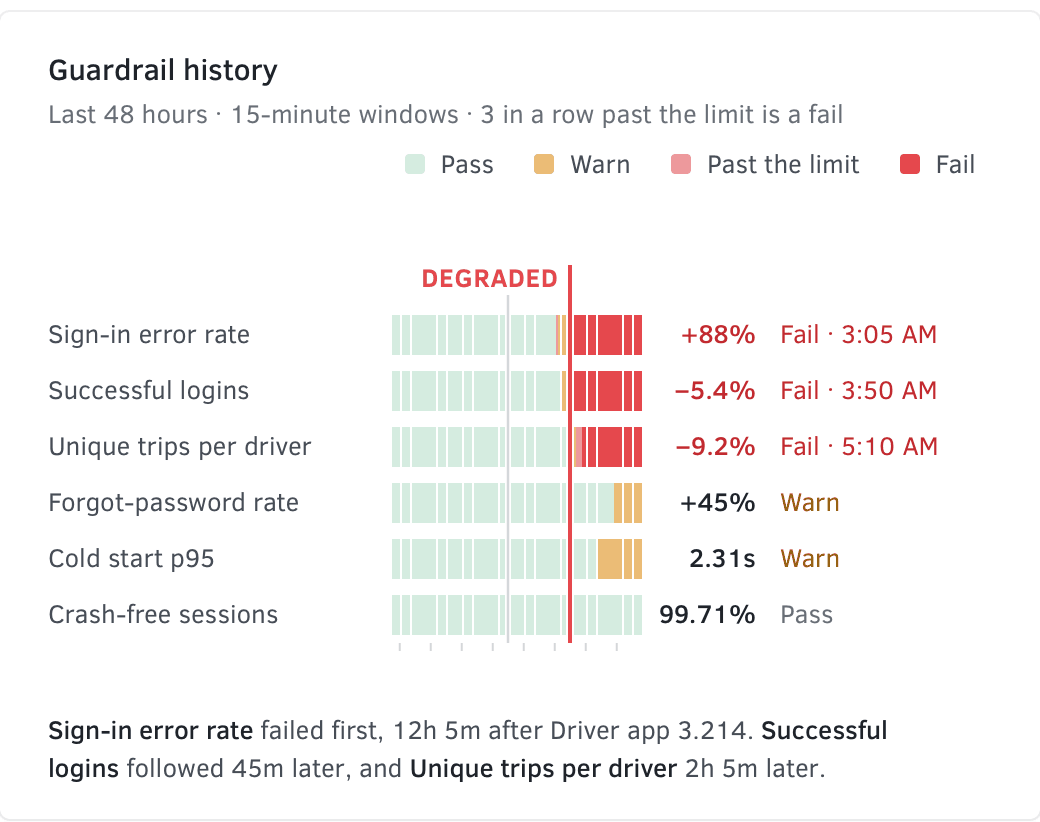
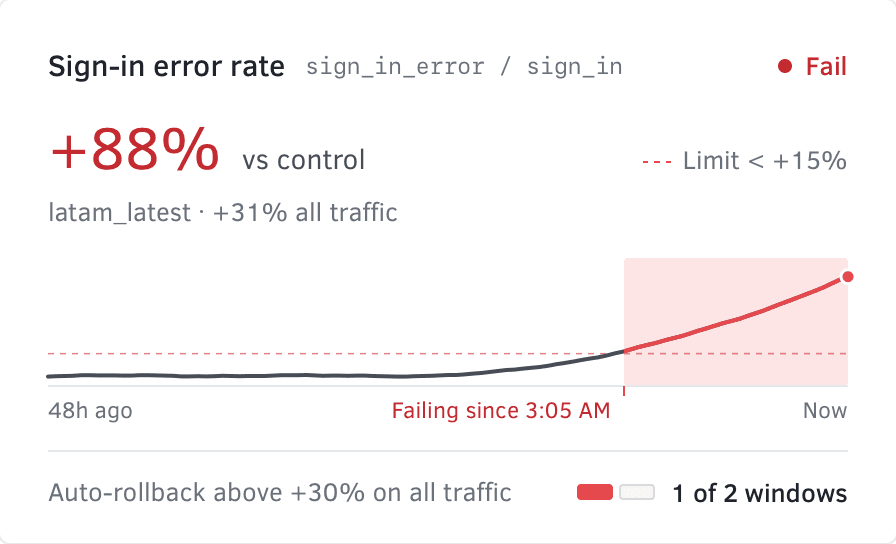
No one can watch a thousand experiments, so every flag carries guardrails: metrics with a limit. A breach marks the flag degraded and pages its owner, and that is all it does. Automatic rollback is a separate rule, written out where everyone can read it: sign-in errors 30% above control, on all traffic, for two 15-minute windows in a row. Automation that acts only inside rules people can read is what I am exploring now in Consentful Automation.
Every state, designed
Most of a flag’s life is quiet, and a page built for incidents makes every launch look like one. So I designed the header state by state, with one primary button for each of its five states: Increase to 50%, Increase to 100%, Roll back, Resume at 25% and Turn on.
- One actionIncrease, roll back, resume or turn on.

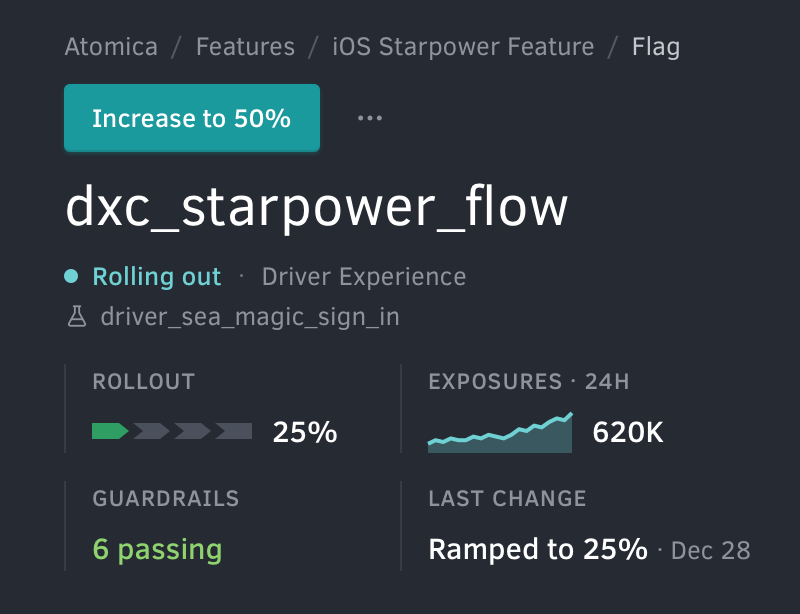

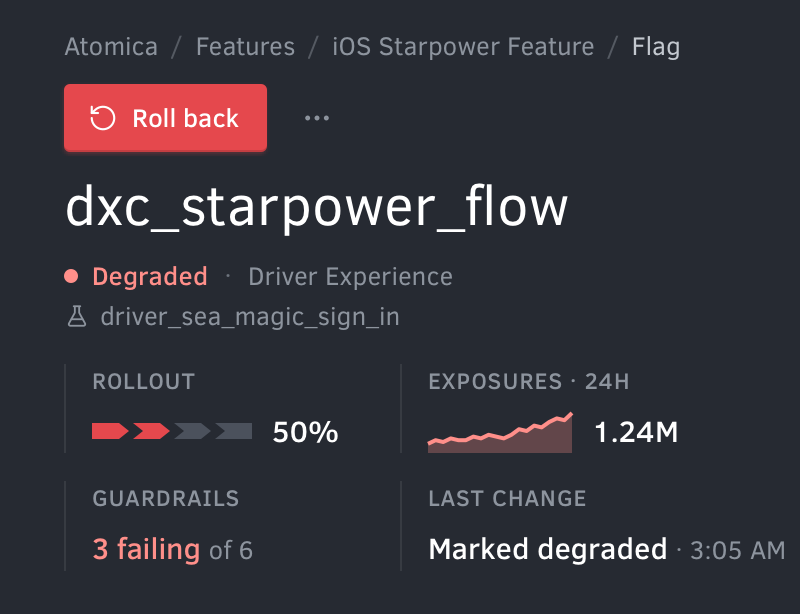

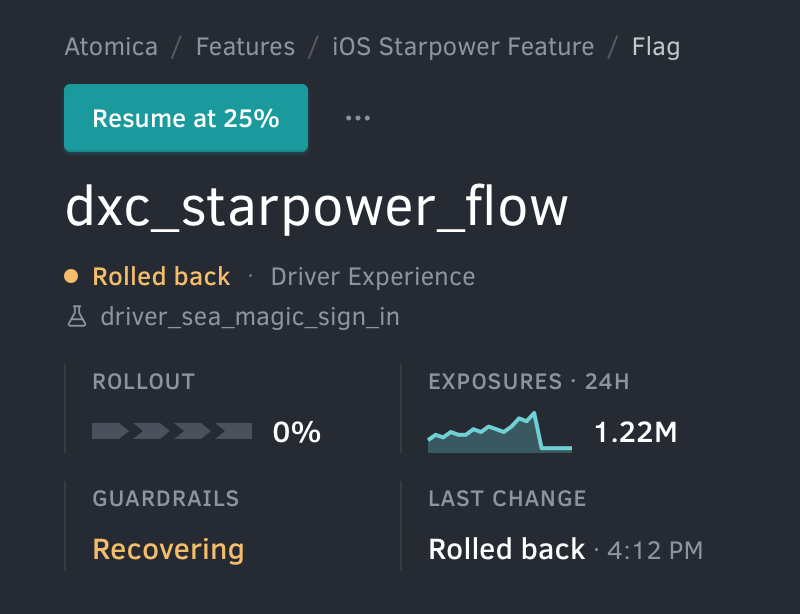

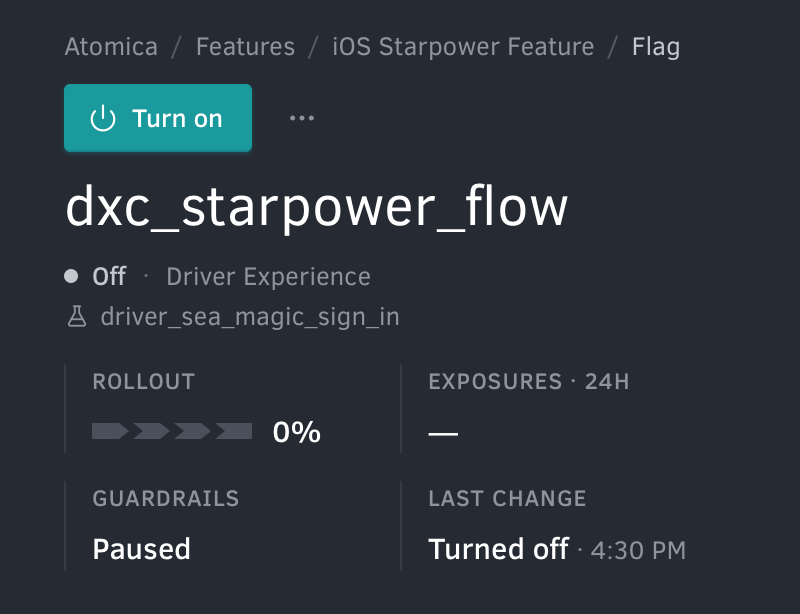

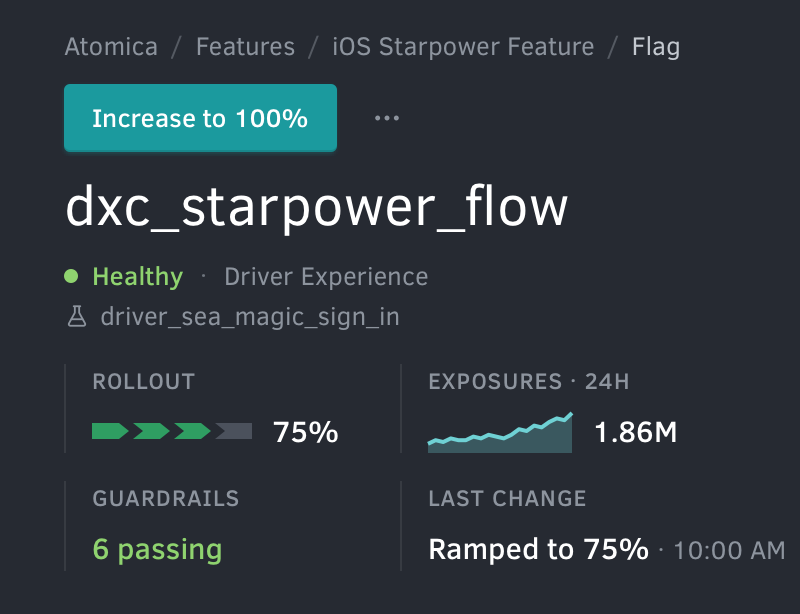
- Name and statusThe flag and its state, in one word.
- RolloutHow far it has ramped, as steps.
- ExposuresDrivers who met the flag in 24 hours.
- GuardrailsHow many pass or fail, of how many.
- Last changeWhat happened last, and when.
Every test ends in a decision
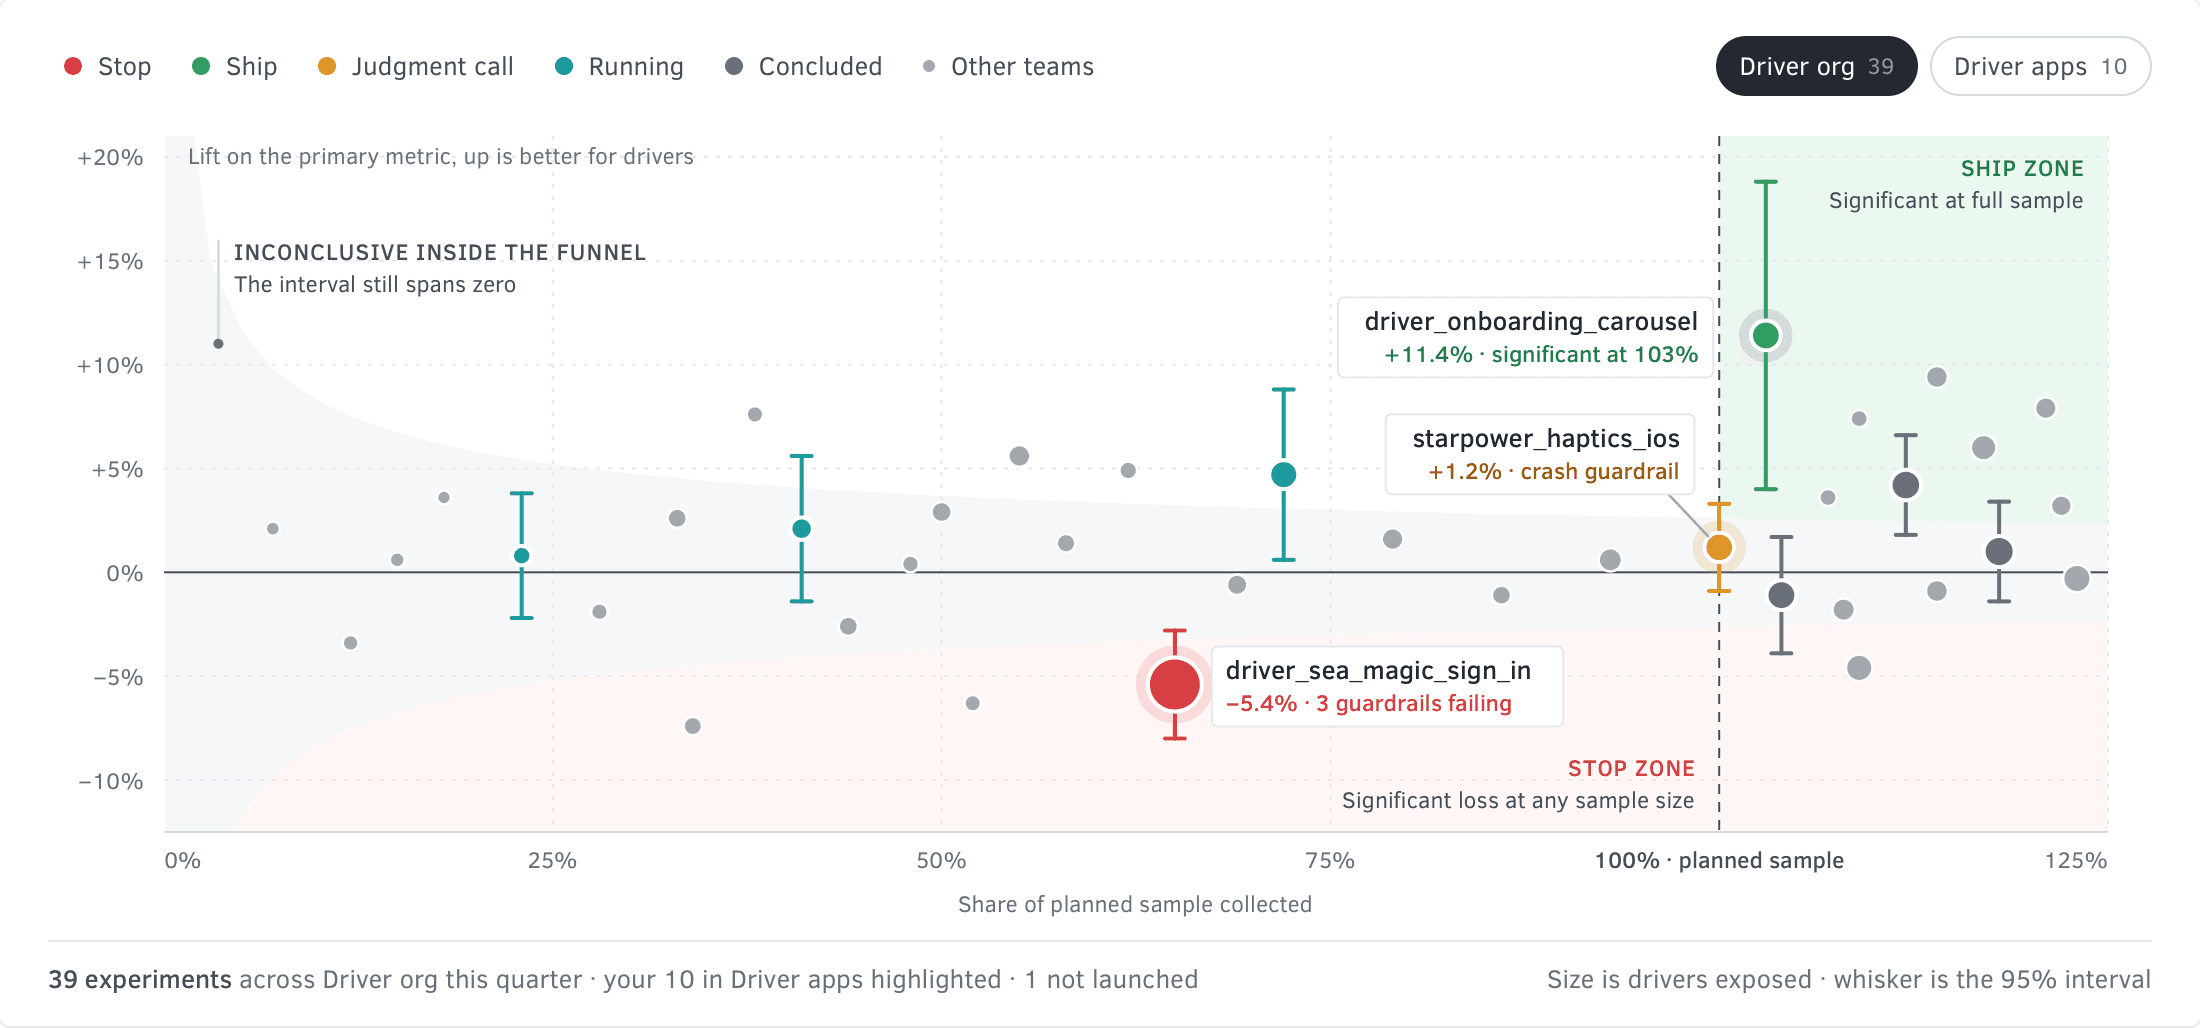
The old list never asked for a decision. The experiments view plots every test by how much of its sample it has collected against its lift. The upper right is ship: a win at the full sample. Below the funnel is stop: a significant loss ends a test at any sample size, because real harm should not wait for the sample to finish.
One inbox for the team
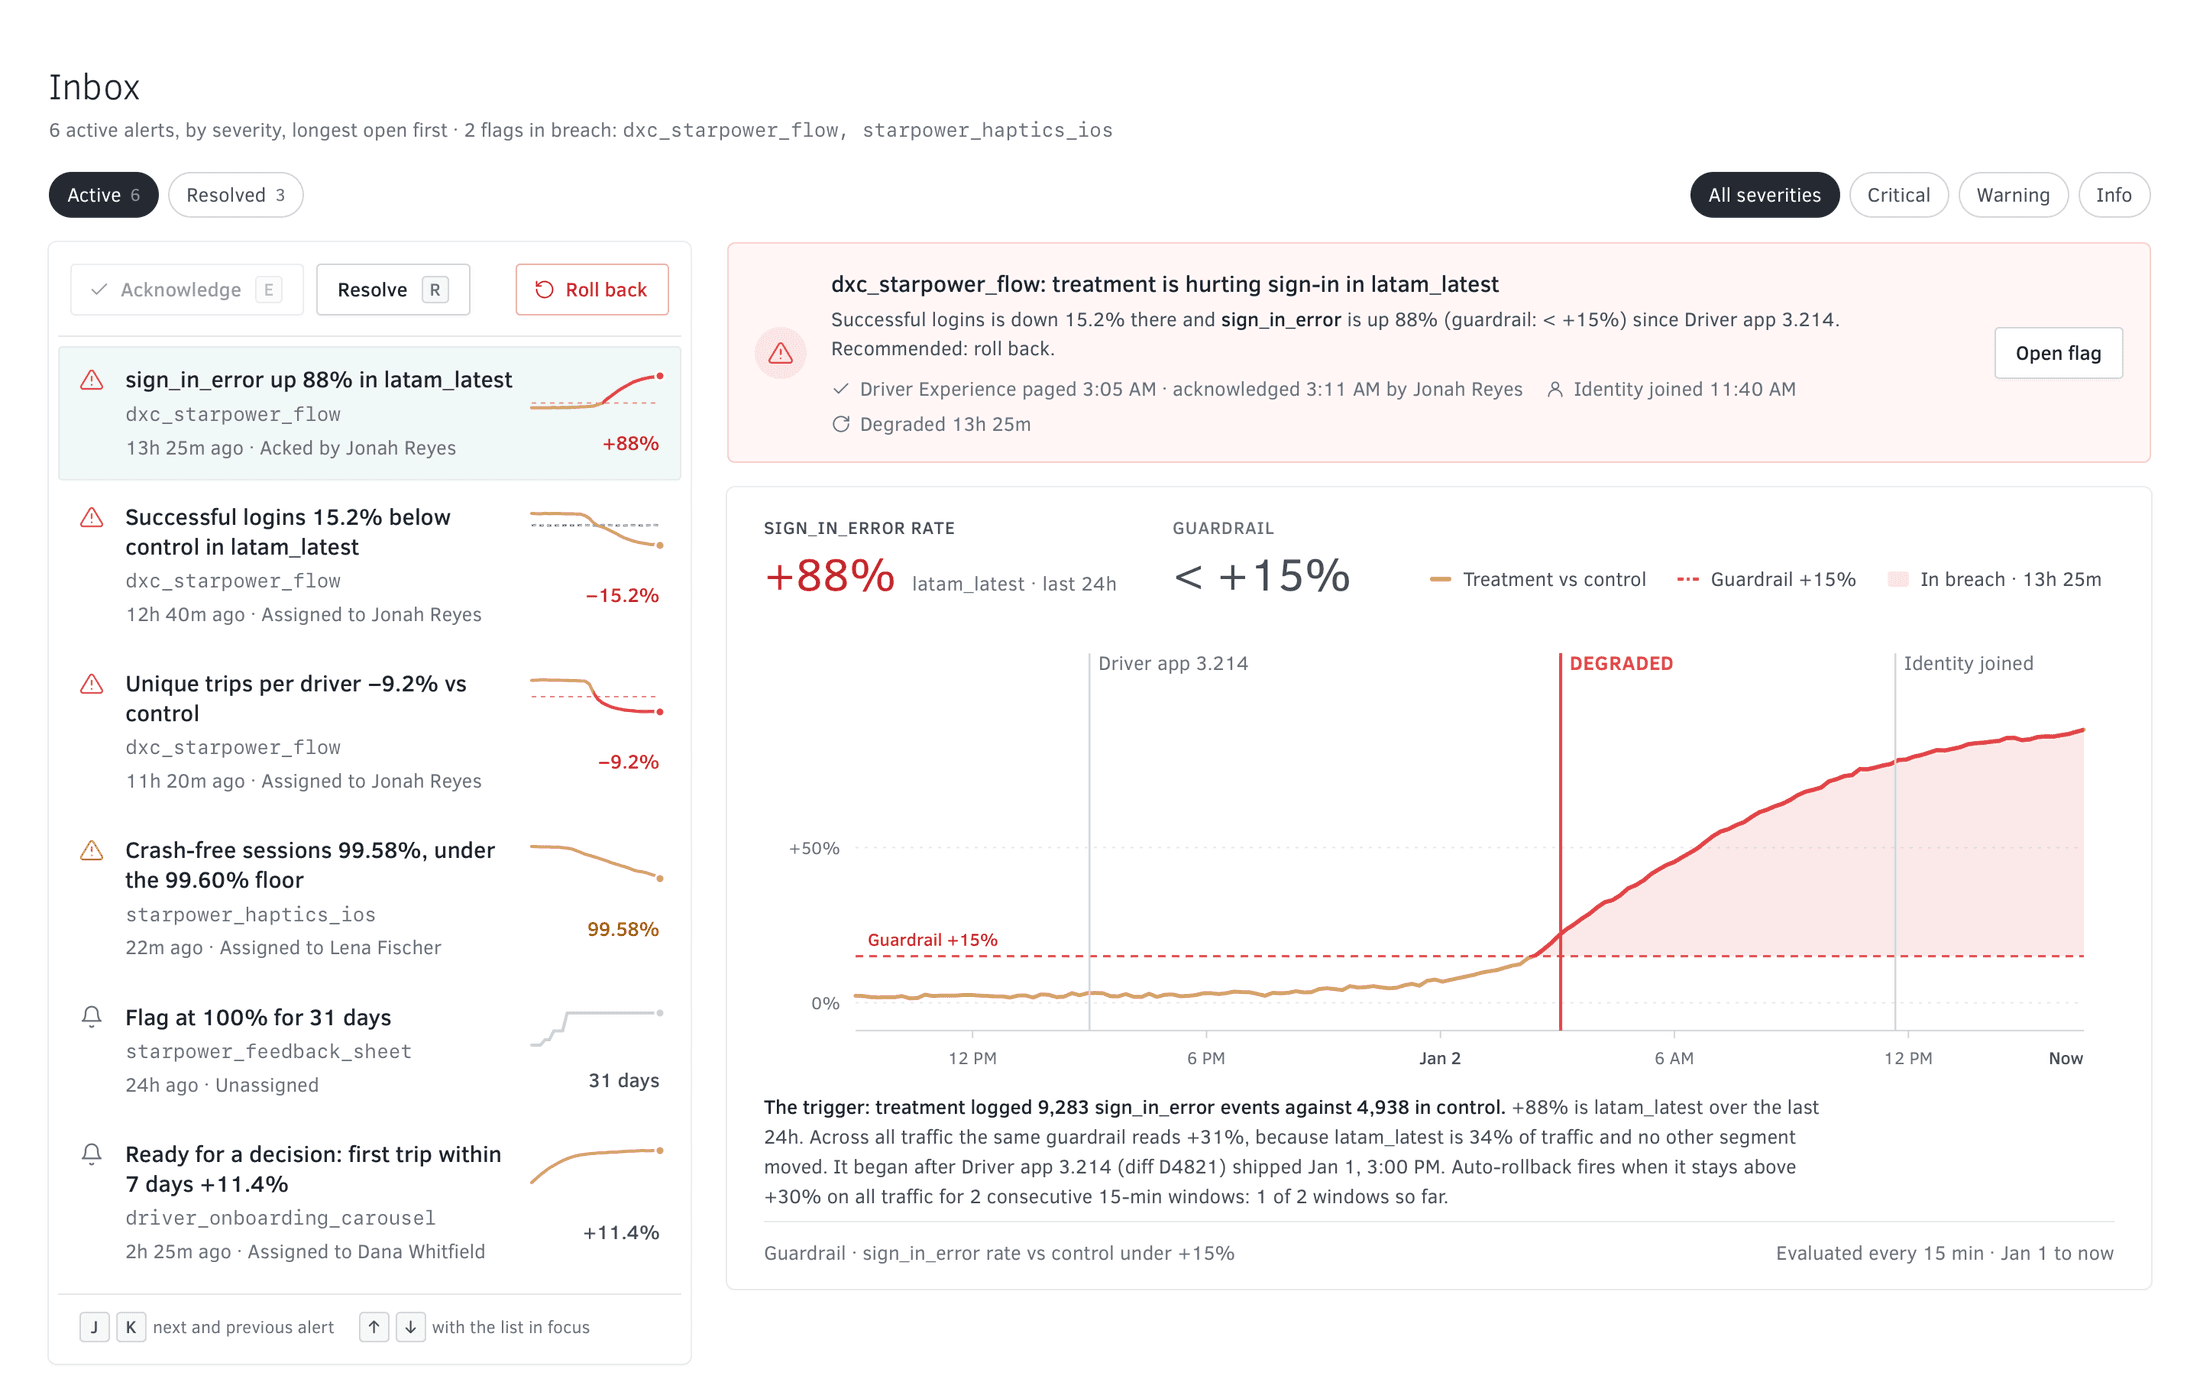
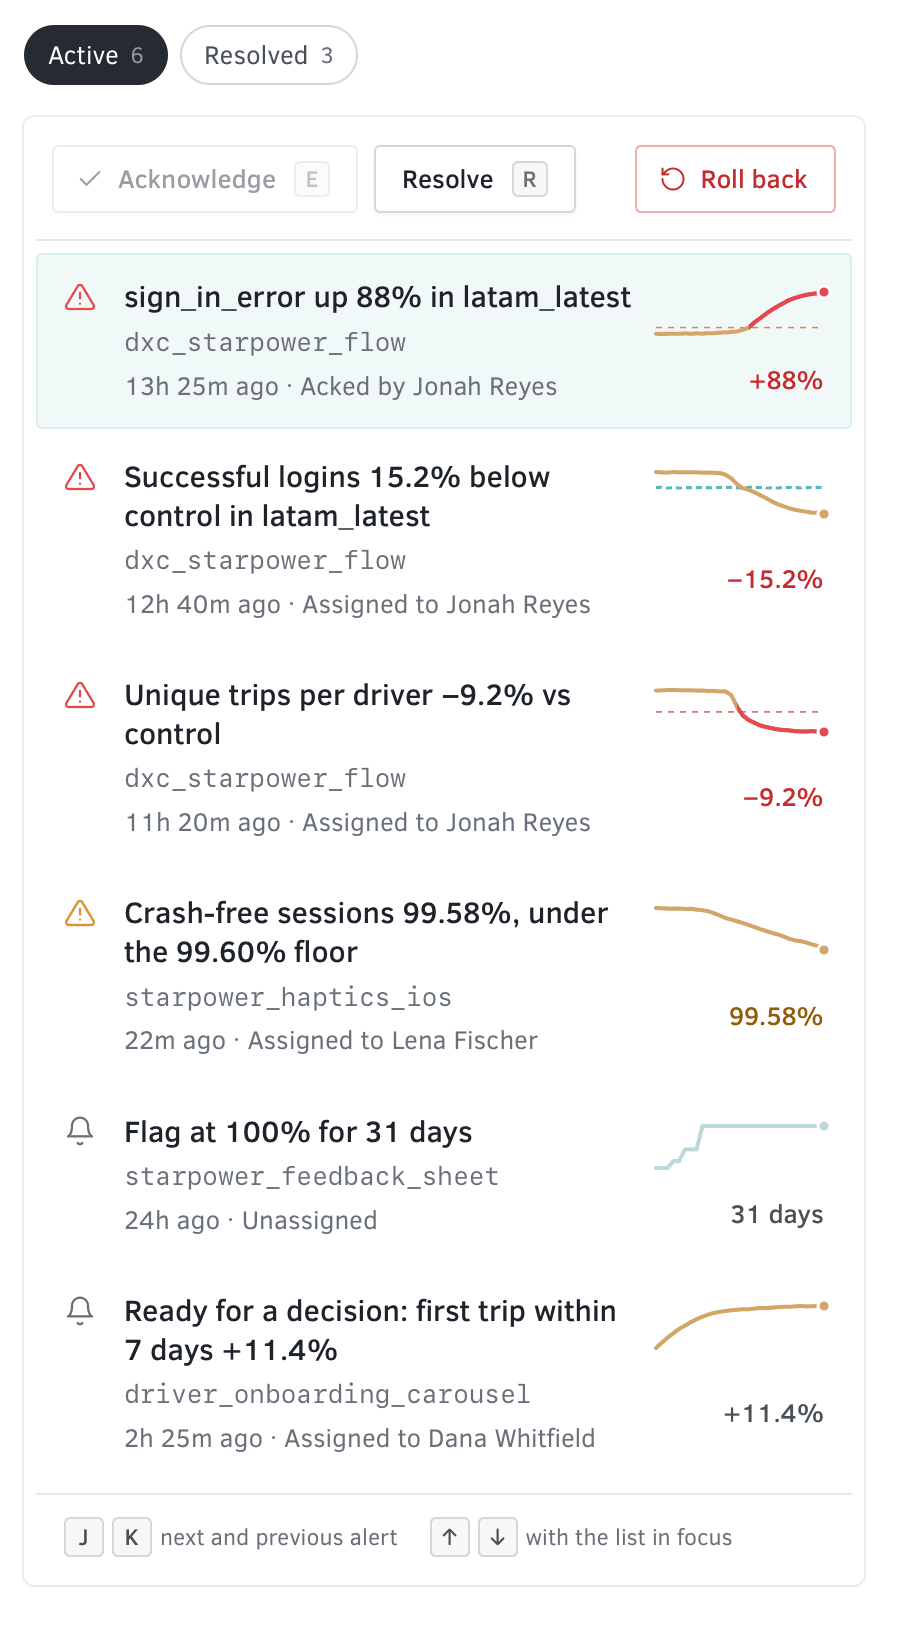
Up a level, a team watches everything it owns. Alerts arrive by severity, each tied to its flag, its owner and what shipped just before. The inbox is worked from the keyboard, with J and K to move through it. Each breach is charted against its own limit.
What we traded
An experimentation platform can’t be made simple. The work was deciding where its complexity goes. The page opens on a sentence and one action. The views and controls for a particular anomaly or a particular rollout plan sit one step behind that, where the person who needs them will look.
Some of the choices cost something. Typing the flag’s name slows down the one person who is in a hurry, on purpose. Automatic rollback acts on all traffic only, and anything narrower stays a person’s call. And we cut all of the data visualization from the first version so the redesign could ship.
Outcome
Atomica replaced Morpheus about three months after we designed and built it. Rollbacks were the clearest win: they got faster, and they could be scoped to the segment that was hurting. In every app that used XP, experiments got easier to manage and faster to run, which made them cheaper.
For scale: in August 2018 Uber wrote that more than 1,000 experiments were running on the platform at any given time, across its driver, rider, Eats and Freight apps.
- Team
- One designer, frontend and backend engineers
- Time
- About three months
- Apps
- Rider, Driver, Eats, Freight, Fleet, Autonomous
- Prototype
- Rebuilt from the 2017 design